Categories: Technical analysis

USDCHF Wave Analysis – 27 August 2025

USDCHF: ⬆️ Buy

– USDCHF reversed from support area

– Likely to rise to resistance level 0.8165

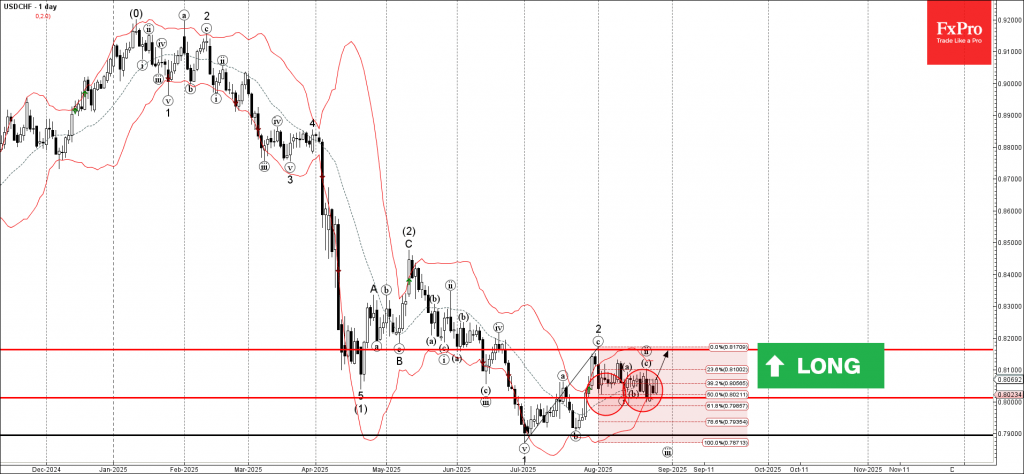
USDCHF currency pair reversed from the support area located between the support level 0.8000, lower daily Bollinger Band and the 50% Fibonacci correction of the upward impulse from July.

The upward reversal from this support area created the daily Japanese candlesticks reversal pattern Piercing Line.

Given the strength of the support level 0.8000, USDCHF currency pair can be expected to rise to the next resistance level 0.8165 (top of wave 2 from the end of July).

The FxPro Tech Analysis Team

The FxPro technical experts prepare a daily analysis of the most active currency pairs (majors, crosses, exotics) and commodities. Selected instruments are reviewed on daily trends (D1, H4), using the active Elliott Wave setups, Japanese candlesticks, indicators, and support/resistance levels.

Share
Published by
The FxPro Tech Analysis Team
Tags: USDCHF

Recent Posts

CADJPY Wave Analysis – 26 December 2025

CADJPY: ⬆️ Buy - CADJPY broke resistance level 114.30 - Likely to rise to resistance…

57 minutes ago

Toncoin Wave Analysis – 26 December 2025

Toncoin: ⬆️ Buy - Toncoin reversed from support zone - Likely to rise to resistance…

57 minutes ago

Nvidia Wave Analysis – 26 December 2025

Nvidia: ⬆️ Buy - Nvidia reversed from support zone - Likely to rise to resistance…

58 minutes ago

Palladium Wave Analysis – 26 December 2025

Palladium: ⬆️ Buy - Palladium reversed from support zone - Likely to rise to resistance…

59 minutes ago

AUDUSD Wave Analysis – 24 December 2025

AUDUSD: ⬆️ Buy - AUDUSD broke key resistance level 0.6690 - Likely to rise to…

2 days ago

Tron Wave Analysis – 24 December 2025

Tron: ⬇️ Sell - Tron reversed from resistance zone - Likely to fall to support…

2 days ago

This website uses cookies