Categories: Technical analysis

USDCHF Wave Analysis – 25 October, 2022

• USDCHF reversed from resistance level 1.0050

• Likely to fall to support level 0.992

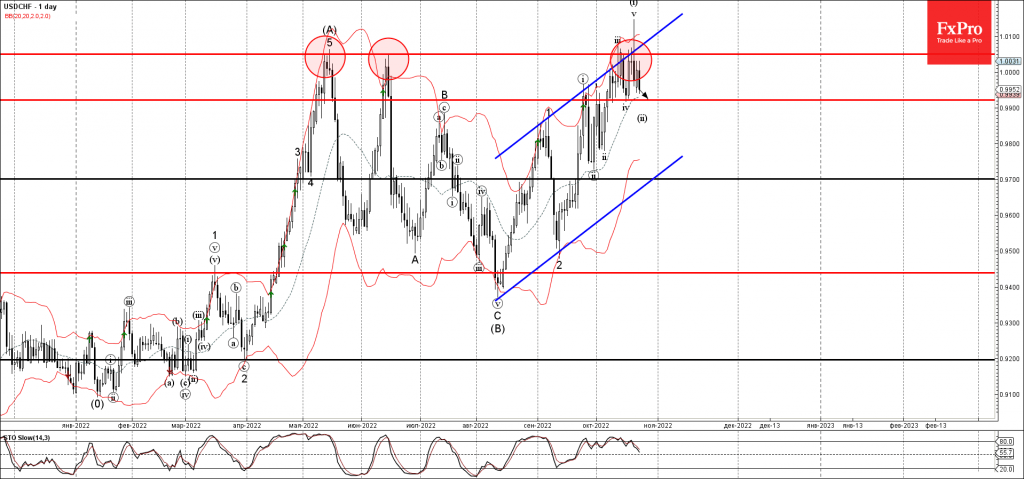
USDCHF recently reversed down from the key multi-month resistance level 1.0050 (which has been reversing the price from May), intersecting with the upper daily Bollinger Band and the resistance trendline of the daily up channel from August.

The downward reversal from the resistance level 1.0050 started the active short-term corrective wave (ii).

USDCHF can be expected to fall further toward the next support level 0.992 (low of the previous minor correction (iv))).

The FxPro Tech Analysis Team

The FxPro technical experts prepare a daily analysis of the most active currency pairs (majors, crosses, exotics) and commodities. Selected instruments are reviewed on daily trends (D1, H4), using the active Elliott Wave setups, Japanese candlesticks, indicators, and support/resistance levels.

Share
Published by
The FxPro Tech Analysis Team
Tags: USDCHF

Recent Posts

EURNZD Wave Analysis – 17 March 2025

EURNZD: ⬇️ Sell - EURNZD reversed from long-term resistance level 1.9160 - Likely to fall…

1 hour ago

AUDUSD Wave Analysis – 17 March 2025

AUDUSD: ⬆️ Buy - AUDUSD broke resistance level 0.6350 - Likely to rise to resistance…

1 hour ago

Weak US retail sales might boost stocks

Weak US retail sales are adding to concerns of a potential recession, putting pressure on…

3 hours ago

Dow Jones: Rebound or Rally? The Fed Holds the Key

The Dow Jones rebound depends on the Federal Reserve's monetary policy and incoming data. It…

4 hours ago

Crypto market fails to confirm reversal

Market Picture The crypto market is consolidating in the $2.70 trillion area, near the bottom…

9 hours ago

Video: Dollar and Indices are trying to find footing after the fall

The dollar experienced a sell-off but rallied back up by the end of the week.…

3 days ago

This website uses cookies