Categories: Technical analysis

USDCHF Wave Analysis 24 September 2024

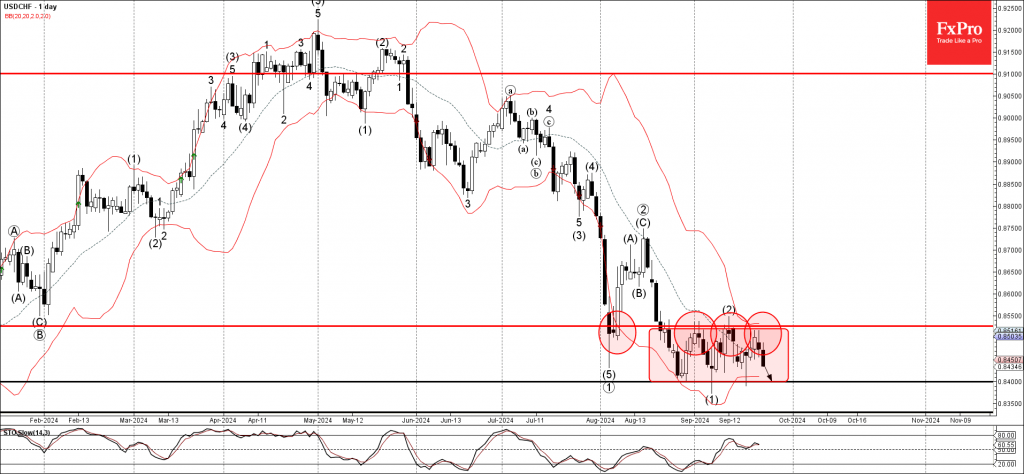
– USDCHF reversed from resistance area

– Likely to fall to support level 0.8400

USDCHF currency pair recently reversed down from the resistance area located at the intersection of the key resistance level 0.8525 (upper border of the narrow sideways price range inside which the pair is moving from August) and the upper daily Bollinger Band.

The downward reversal from this resistance area is likely to form the daily Evening Star – if the pair closes today near the current levels.

Given the clear daily downtrend, USCHF can be expected to fall further to the next support level 0.8400 (lower boundary of the active sideways price range).

The FxPro Tech Analysis Team

The FxPro technical experts prepare a daily analysis of the most active currency pairs (majors, crosses, exotics) and commodities. Selected instruments are reviewed on daily trends (D1, H4), using the active Elliott Wave setups, Japanese candlesticks, indicators, and support/resistance levels.

Share
Published by
The FxPro Tech Analysis Team
Tags: USDCHF

Recent Posts

GBPUSD Wave Analysis 24 September 2024

- GBPUSD broke resistance area - Likely to rise to resistance level 1.3500 GBPUSD recently…

1 hour ago

Services sector underpins US economy amid manufacturing slowdown

The US manufacturing PMI fell to 47.0 in September. The services sector remains a solid…

9 hours ago

China’s stimulus boosts yuan and shares

China announced a cut in key interest rates and reserve ratios, freeing up 1 trillion…

9 hours ago

Bitcoin keeps at heights, Litecoin pushes back from resistance

Bitcoin is showing a moderate trend with intraday fluctuations as it continues to fight for…

14 hours ago

Natural Gas Wave Analysis 23 September 2024

- Natural Gas rising inside impulse waves 3 and (3) - Likely to reach resistance…

1 day ago

EURGBP Wave Analysis 23 September 2024

- EURGBP broke the support area - Likely to fall to support level 0.8300 EURGBP…

1 day ago

This website uses cookies