Categories: Technical analysis

USDCHF Wave Analysis 20 August 2024

– USDCHF reversed from resistance area

– Likely to fall to support level 0.8500

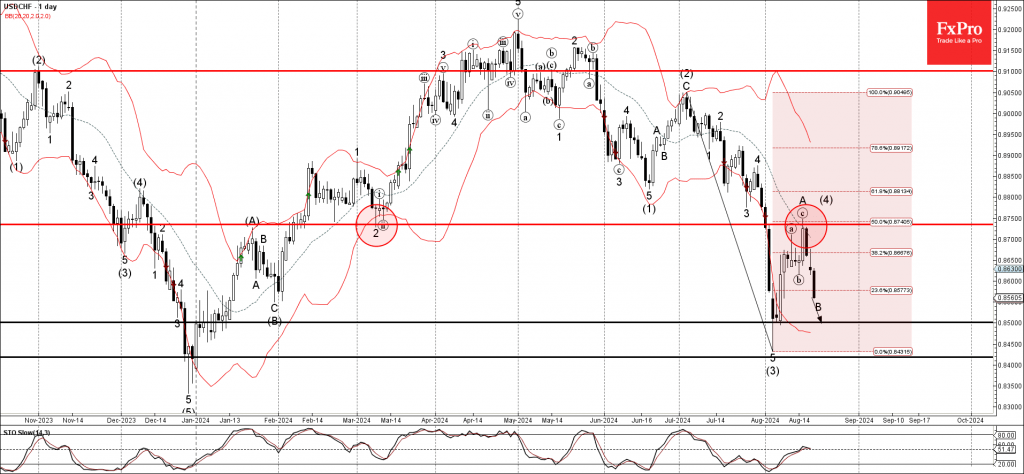
USDCHF currency pair recently reversed down from the resistance area set between the resistance level 0.8735 (former monthly low from March), 20-day moving average and the 50% Fibonacci correction of the downward impulse from the start of July.

The downward reversal from this resistance area started the active minor corrective wave B, which belongs to the ABC correction (4).

Given the widespread US dollar sales and multi-month downtrend, USDCHF currency pair can be expected to fall further toward the next support level 0.8500 (target for the completion of the active wave B).

The FxPro Tech Analysis Team

The FxPro technical experts prepare a daily analysis of the most active currency pairs (majors, crosses, exotics) and commodities. Selected instruments are reviewed on daily trends (D1, H4), using the active Elliott Wave setups, Japanese candlesticks, indicators, and support/resistance levels.

Share
Published by
The FxPro Tech Analysis Team
Tags: USDCHF

Recent Posts

AUDCAD Wave Analysis 18 September 2024

- AUDCAD broke pivotal resistance level 0.9170 - Likely to rise to resistance level 0.9260…

6 hours ago

WTI Wave Analysis 18 September 2024

- WTI reversed from round resistance level 70.00 - Likely to fall to support level…

6 hours ago

Strong data didn’t derail markets from expectations of a 50bp Fed cut

US retail sales rose 0.1% m/m in August, better than forecast, but sales growth in…

14 hours ago

The crypto market gets a boost from stocks

Market Picture The crypto market has gained 2.1% in the last 24 hours to reach…

17 hours ago

MasterCard Wave Analysis 17 September 2024

- MasterCard broke round resistance level 500.00 - Likely to rise to the resistance level…

1 day ago

CHFJPY Wave Analysis 17 September 2024

- CHFJPY reversed from support zone - Likely to rise to the resistance level 168.45…

1 day ago

This website uses cookies