Categories: Technical analysis

USDCHF Wave Analysis 2 December, 2020

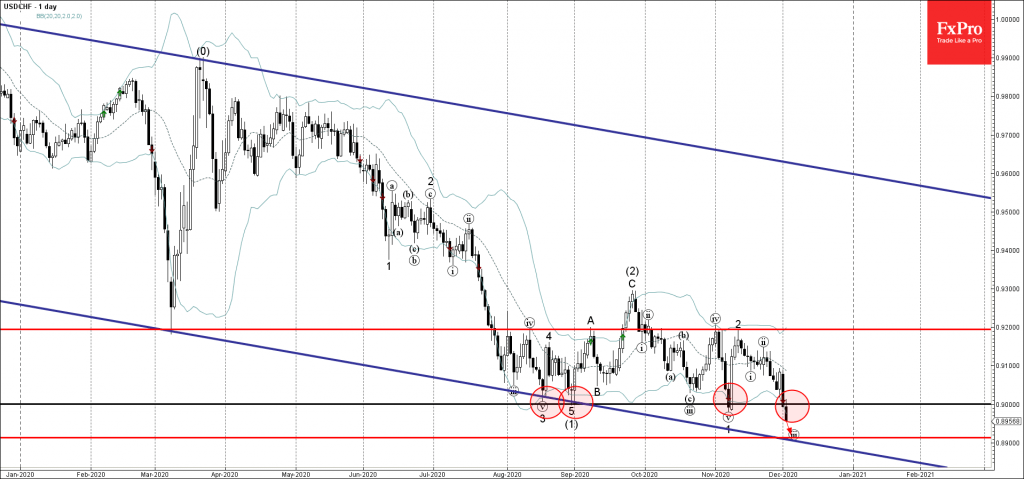
• USDCHF broke round support level 0.9000

• Likely to fall to 0.8900

USDCHF recently broke the round support level 0.9000 (which has previously reversed all sharp downward impulses from the end of August – as can be seen from the daily USDCHF chart below).

The breakout of the support level 0.9000 continues the prevailing downtrend that can be seen on the daily and the weekly Swiss franc charts.

USDCHF is expected to fall further toward the next support level 0.8900 (forecast price for the completion of the active impulse wave (iii) intersecting with the weekly down channel from 2019).

The FxPro Tech Analysis Team

The FxPro technical experts prepare a daily analysis of the most active currency pairs (majors, crosses, exotics) and commodities. Selected instruments are reviewed on daily trends (D1, H4), using the active Elliott Wave setups, Japanese candlesticks, indicators, and support/resistance levels.

Share
Published by
The FxPro Tech Analysis Team
Tags: USDCHF

Recent Posts

A new stage of Bitcoin’s decline 

Market Picture  Bitcoin's closing price on Tuesday became the lowest since late February, confirming the…

3 hours ago

Ebay Wave Analysis 30 April 2024

- Ebay under the bearish pressure - Likely to fall to support level 51.00 Ebay…

16 hours ago

GBPAUD Wave Analysis 30 April 2024

- GBPAUD reversed from key support level 1.9135 - Likely to rise to resistance level…

16 hours ago

Silver: a possible long road down

Silver has lost 2.6% since the start of the day on Tuesday to $26.4 per…

19 hours ago

Another Dip in Crypto Capitalization

Market picture  The crypto market capitalisation decreased by another 1.5% to $2.27 trillion, getting closer…

23 hours ago

ANF Wave Analysis 29 April 2024

ANF reversed from key support level 113.40 Likely to rise to resistance level 132.31 ANF…

2 days ago

This website uses cookies