Categories: Technical analysis

USDCHF Wave Analysis – 18 February 2025

– USDCHF reversed from the support zone

– Likely to rise to resistance level 0.9150

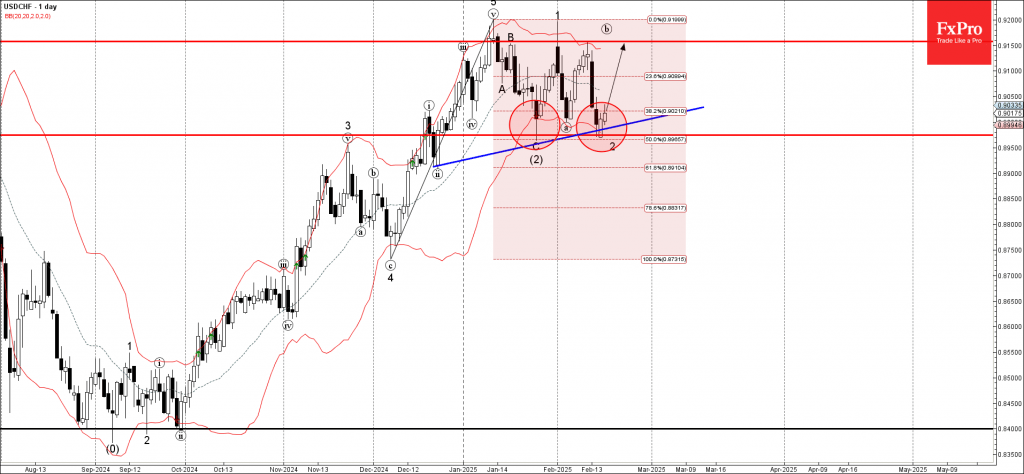
USDCHF currency pair recently reversed up from the support zone located between the support level 0.8975 (which stopped wave (2) in January), support trendline from December, lower daily Bollinger Band and the 50% Fibonacci correction of the upward impulse from December.

The price formed the daily Japanese candlesticks reversal pattern Piercing Line near this support zone.

Given the strong daily uptrend, USDCHF currency pair can be expected to rise to the next resistance level 0.9150 (which has been reversing the price from January).

AddThis Website Tools
The FxPro Tech Analysis Team

The FxPro technical experts prepare a daily analysis of the most active currency pairs (majors, crosses, exotics) and commodities. Selected instruments are reviewed on daily trends (D1, H4), using the active Elliott Wave setups, Japanese candlesticks, indicators, and support/resistance levels.

Share
Published by
The FxPro Tech Analysis Team
Tags: USDCHF

Recent Posts

Nikkei 225 Wave Analysis – 23 April 2025

Nikkei 225: ⬆️ Buy - Nikkei 225 broke the resistance area - Likely to rise…

10 hours ago

EURCHF Wave Analysis – 23 April 2025

EURCHF: ⬆️ Buy - EURCHF broke the resistance area - Likely to rise to resistance…

10 hours ago

CADJPY Wave Analysis – 23 April 2025

CADJPY: ⬆️ Buy - CADJPY reversed from strong support area - Likely to rise to…

11 hours ago

USDJPY Wave Analysis – 23 April 2025

USDJPY: ⬆️ Buy - USDJPY reversed from the support area - Likely to rise to…

11 hours ago

Europe’s Growth Stalls Again as the Euro Enters Correction Mode

Eurozone business activity slows as falling orders and declining confidence impact growth. Manufacturing PMI remains…

16 hours ago

The Rapid Assault on Crypto

The cryptocurrency market experienced a significant surge, with market capitalisation reaching $2.95 trillion. Bitcoin is…

20 hours ago