Categories: Technical analysis

USDCHF Wave Analysis – 18 August, 2020

• USDCHF broke key support level 0.9060

• Likely to fall to 0.9000

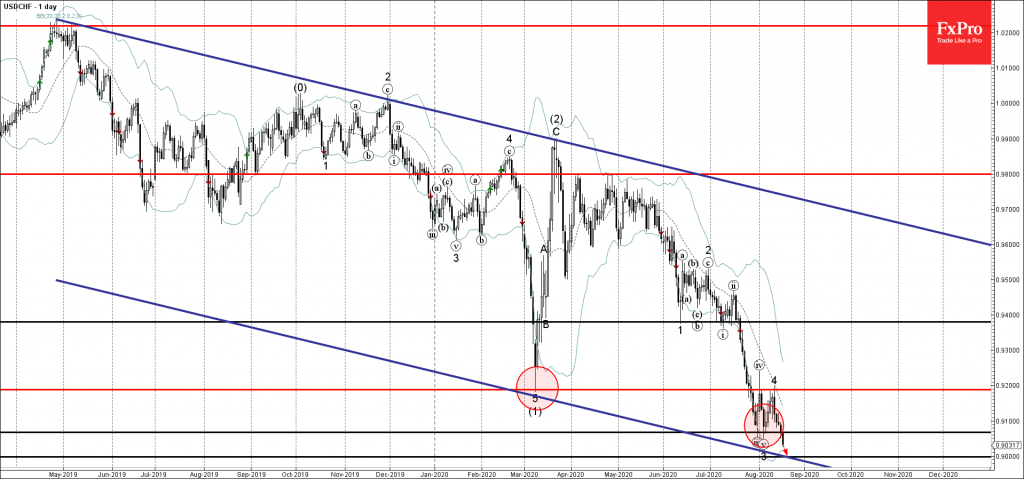
USDCHF today broke below the key support level 0.9060 (which stopped the previous waves (iii) and 3 earlier this month – as can be seen below).

The breakout of the support level 0.9060 continues the active short-term impulse wave 5 – which belongs to the extended downward impulse sequence (3) from March.

USDCHF is likely to fall further toward the next round support level 0.9000 (intersecting with the lower support trendline of the wide weekly down channel from May of 2019).

The FxPro Tech Analysis Team

The FxPro technical experts prepare a daily analysis of the most active currency pairs (majors, crosses, exotics) and commodities. Selected instruments are reviewed on daily trends (D1, H4), using the active Elliott Wave setups, Japanese candlesticks, indicators, and support/resistance levels.

Share
Published by
The FxPro Tech Analysis Team
Tags: USDCHF

Recent Posts

Brent Crude oil Wave Analysis – 13 January 2026

Brent Crude oil ⬆️ Buy - Brent Crude oil rising inside impulse wave c -…

17 minutes ago

USDJPY Wave Analysis – 13 January 2026

USDJPY ⬆️ Buy - USDJPY broke resistance area - Likely to rise to resistance level…

18 minutes ago

Exxon Mobil Wave Analysis – 13 January 2026

Exxon Mobil ⬆️ Buy - Exxon Mobil broke resistance level 125.60 - Likely to rise…

19 minutes ago

BNB Wave Analysis – 13 January 2026

Brent Crude oil ⬆️ Buy - BNB broke out of sideways price range - Likely…

19 minutes ago

A slightly weaker CPI was not enough to break through the highs

US CPI data a bit softer than forecasts, sparking brief market optimism, but resistance remains.…

6 hours ago

Pro News Flash: Global Tensions Fuel a Fresh Oil Rally

🛢️ Oil prices are finding fresh strength as geopolitical tensions in the Middle East reignite…

6 hours ago

This website uses cookies