Categories: Technical analysis

USDCHF Wave Analysis – 12 October, 2022

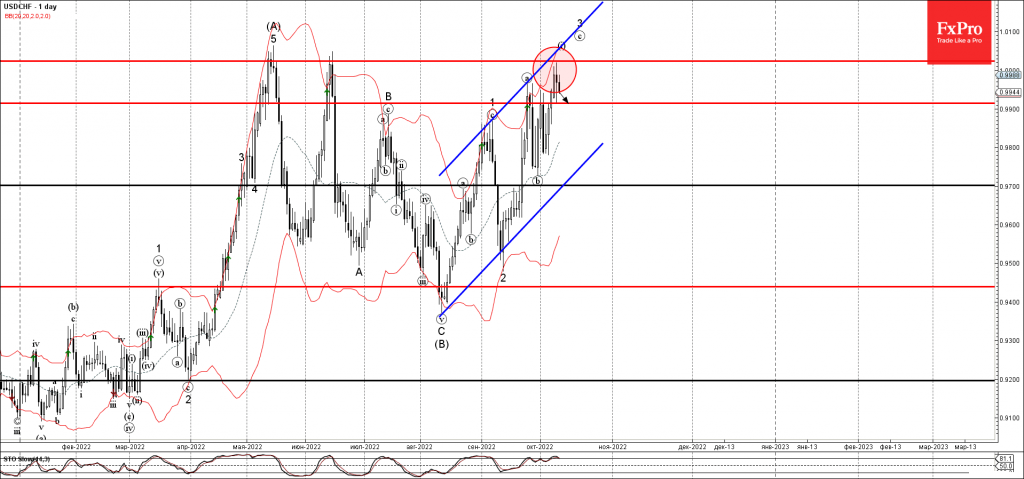
• USDCHF reversed from resistance zone

• Likely to fall to support level 0.9915

USDCHF recently reversed down from the resistance zone lying between the key resistance level 1.0025

(which has been reversing the pair from May), upper daily Bollinger Band and the resistance trendline of the daily up channel from April.

The downward reversal from this resistance zone stopped the earlier short-term impulse wave (i).

Given the overbought daily Stochastic, USDCHF can be expected to fall further toward the next support level 0.9915.

The FxPro Tech Analysis Team

The FxPro technical experts prepare a daily analysis of the most active currency pairs (majors, crosses, exotics) and commodities. Selected instruments are reviewed on daily trends (D1, H4), using the active Elliott Wave setups, Japanese candlesticks, indicators, and support/resistance levels.

Share
Published by
The FxPro Tech Analysis Team
Tags: USDCHF

Recent Posts

AUDJPY Wave Analysis – 5 December 2025

AUDJPY: ⬆️ Buy - AUDJPY broke long-term resistance level 102.30 - Likely to rise to…

2 hours ago

Aptos Wave Analysis – 5 December 2025

Aptos: ⬇️ Sell - Aptos testing major support at 1.688 - Likely to fall to…

2 hours ago

Pro News Weekly: Market Shake-Up, Dollar Drops, Gold Surges, Bitcoin Wobbles!

Welcome to Pro News Flash! 💵 The U.S. dollar slips 🏆 Major stock indices struggle…

8 hours ago

Solana Wave Analysis – 5 December 2025

Solana: ⬇️ Sell - Solana reversed from resistance zone - Likely to fall to support…

9 hours ago

EURAUD Wave Analysis – 5 December 2025

EURAUD : ⬇️ Sell - EURAUD broke the support level 1.7600 - Likely to fall…

9 hours ago

Forex has set its priorities

In 2026, experts favour the yen, see modest euro growth, and expect pressure on the…

13 hours ago

This website uses cookies