Categories: Technical analysis

USDCHF Wave Analysis – 10 September 2025

USDCHF: ⬆️ Buy

– USDCHF reversed from support area

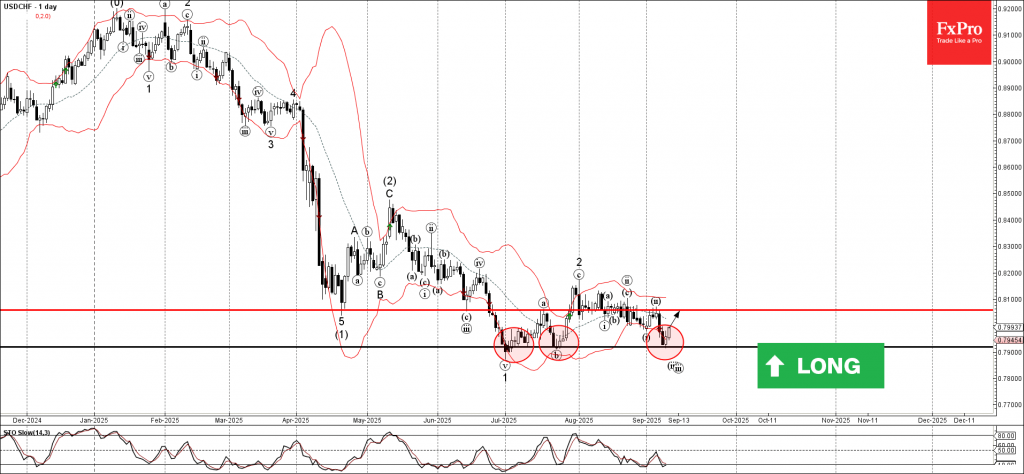
– Likely to rise to resistance level 0.8055

USDCHF currency pair recently reversed from the support area between the strong support level 0.7918 (which has been reversing the price from the end of June) and the lower daily Bollinger Band.

The upward reversal from this support area will form the daily Japanese candlesticks reversal pattern Morning Star – if the pair closes today near the current levels.

Given the strength of the support level 0.7918 and the oversold daily Stochastic, USDCHF currency pair can be expected to rise toward the next resistance level 0.8055 (top of the previous correction ii).

The FxPro Tech Analysis Team

The FxPro technical experts prepare a daily analysis of the most active currency pairs (majors, crosses, exotics) and commodities. Selected instruments are reviewed on daily trends (D1, H4), using the active Elliott Wave setups, Japanese candlesticks, indicators, and support/resistance levels.

Share
Published by
The FxPro Tech Analysis Team
Tags: USDCHF

Recent Posts

Crypto fails to find support for a breakout

Crypto markets fell amid caution; Bitcoin and Ethereum face technical and investor shifts, with privacy…

2 minutes ago

NZDCAD Wave Analysis – 7 January 2026

NZDCAD: ⬆️ Buy - NZDCAD reversed from support zone - Likely to rise to resistance…

14 hours ago

Bitcoin Wave Analysis – 7 January 2026

Bitcoin: ⬇️ Sell - Bitcoin reversed from resistance zone - Likely to fall to support…

14 hours ago

EURGBP Wave Analysis – 7 January 2026

EURGBP: ⬆️ Buy - EURGBP reversed from support zone - Likely to rise to resistance…

14 hours ago

Brent Crude Oil Wave Analysis – 7 January 2026

Brent Crude Oil: ⬇️ Sell - Brent Crude Oil reversed from resistance zone - Likely…

14 hours ago

Old fears about the euro have returned

The resurgence of the political crisis in France is weighing on EURUSD The US dollar…

23 hours ago

This website uses cookies