Categories: Technical analysis

USDCHF Wave Analysis – 10 June, 2020

• USDCHF broke key support level 0.9500

• Likely to fall to 0.9400

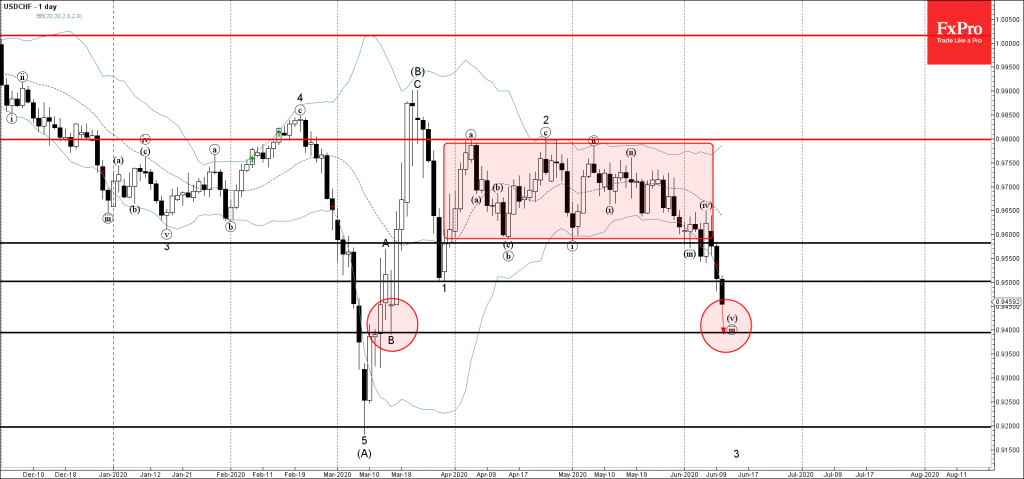
USDCHF continues to fall after the earlier breakout of the key support level 0.9500 (former low of the previous short-term impulse wave 1 from the end of March).

The breakout of the support level 0.9500 was preceded by the breakout of the support level 0.9580 (lower boundary of the sideways price range from the start of April).

USDCHF is likely to fall further in the active short-term impulse wave (iii) toward the next support level 0.9400 (low of wave B from March and the target for the completion of wave (iii)).

AddThis Website Tools
The FxPro Tech Analysis Team

The FxPro technical experts prepare a daily analysis of the most active currency pairs (majors, crosses, exotics) and commodities. Selected instruments are reviewed on daily trends (D1, H4), using the active Elliott Wave setups, Japanese candlesticks, indicators, and support/resistance levels.

Share
Published by
The FxPro Tech Analysis Team
Tags: USDCHF

Recent Posts

US sales jump gives USD relief, but is driven by fears

US Total retail sales rose 1.4% in March, beating the expected 1.3% after rising 0.2%…

29 minutes ago

Tariff news and resistance zone put pressure on crypto

The crypto market capitalisation decreased by 2.6% in 24 hours due to the announcement of…

4 hours ago

Gold Wave Analysis – 16 April 2025

Gold: ⬆️ Buy - Gold broke resistance zone - Likely to rise to the resistance…

8 hours ago

GBPUSD Wave Analysis – 16 April 2025

GBPUSD: ⬆️ Buy - GBPUSD broke key resistance level 1.3200 - Likely to rise to…

8 hours ago

Platinum Wave Analysis – 15 April 2025

Platinum: ⬆️ Buy - Platinum reversed from support level 905.00 - Likely to rise to…

17 hours ago

USDJPY Wave Analysis – 15 April 2025

USDJPY: ⬆️ Buy - USDJPY reversed from long-term support level 142.00 - Likely to rise…

17 hours ago