Categories: Technical analysis

USDCHF Wave Analysis – 10 January, 2020

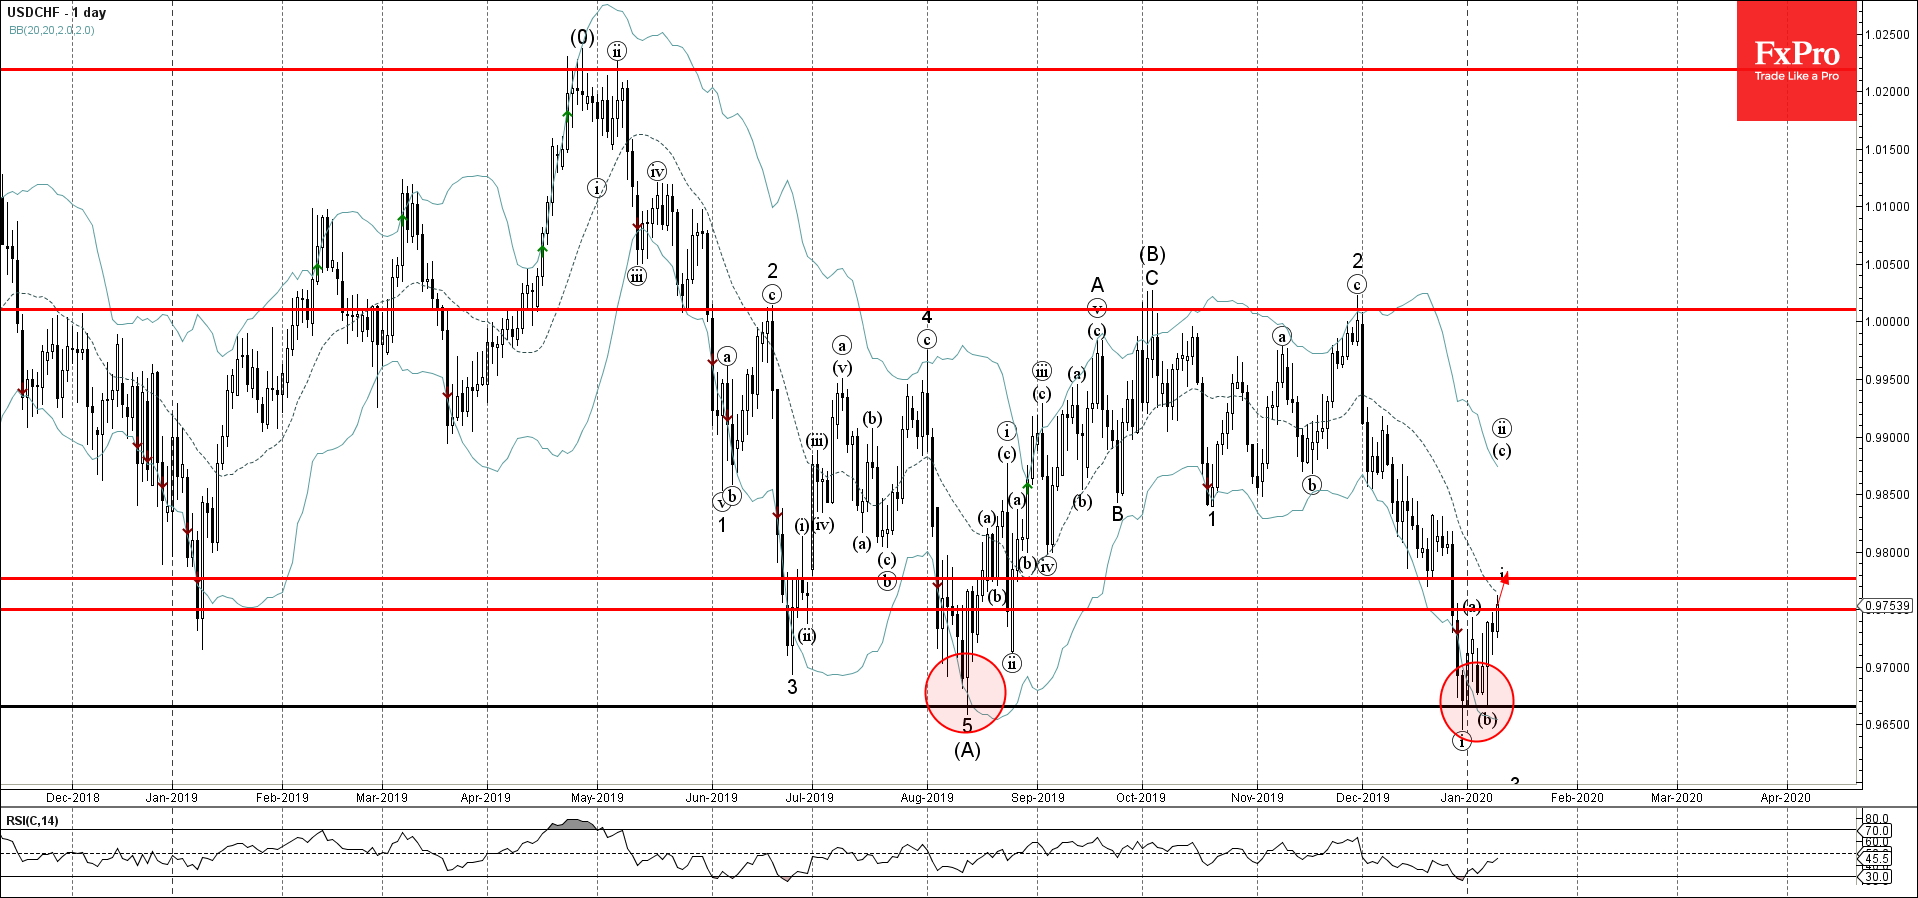
  • USDCHF rising inside impulse wave (c)
  • Likely to rise to 0.9775

USDCHF has been rising in the last few trading sessions inside the short-term impulse wave (c) – which started recently from the support area lying between the strong support level 0.9665 (which stopped the sharp downtrend in August) and the lower daily Bollinger Band.

The active impulse wave (c) belongs to the ABC correction (ii) – which also started previously from the aforementioned support area.

USDCHF is likely to rise further toward the next resistance level 0.9775 (former support from December and the target for the completion of the active impulse i).

The FxPro Tech Analysis Team

The FxPro technical experts prepare a daily analysis of the most active currency pairs (majors, crosses, exotics) and commodities. Selected instruments are reviewed on daily trends (D1, H4), using the active Elliott Wave setups, Japanese candlesticks, indicators, and support/resistance levels.

Share
Published by
The FxPro Tech Analysis Team
Tags: USDCHF

Recent Posts

Nikkei 225 Wave Analysis – 4 April 2025

Nikkei 225: ⬇️ Sell - Nikkei 225 broke support zone - Likely to fall to…

2 days ago

Gold Wave Analysis – 4 April 2025

Gold: ⬇️ Sell - Gold broke daily up channel - Likely to fall to support…

2 days ago

Video Pro News Weekly

The U.S. dollar takes a major hit as trade tariffs spark capital flight, while global…

3 days ago

Mad Gold and Crude Oil

Gold experienced a significant increase followed by a sharp decline. It may be a good…

3 days ago

The US index’s demise has accelerated after confirming the downtrend

US indices fell after tough tariffs were announced by Trump, triggering a negative reaction in…

3 days ago

Tariff wars made the dollar a risky asset

The US dollar is experiencing a decline due to trade tariffs and capital flight. The…

3 days ago

This website uses cookies