Categories: Technical analysis

USDCHF Wave Analysis 1 March, 2021

• USDCHF broke resistance area

• Likely to rise to 0.9200

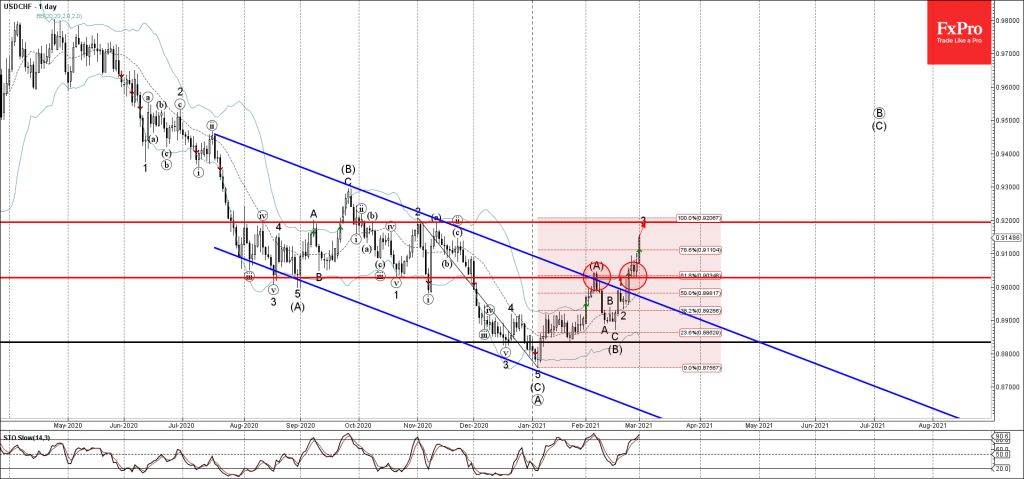
USDCHF recently broke the resistance area located between the resistance level 0.9030 (top of the previous correction (A)) and the 61.8% Fibonacci correction of the previous sharp downward impulse from November.

The breakout of this resistance area accelerated the active impulse waves 3 and (C).

USDCHF is likely to rise further toward the next resistance level 0.9200 (target price for the completion of the active impulse wave 3, former monthly high from November).

The FxPro Tech Analysis Team

The FxPro technical experts prepare a daily analysis of the most active currency pairs (majors, crosses, exotics) and commodities. Selected instruments are reviewed on daily trends (D1, H4), using the active Elliott Wave setups, Japanese candlesticks, indicators, and support/resistance levels.

Share
Published by
The FxPro Tech Analysis Team
Tags: USDCHF

Recent Posts

Qualcomm Wave Analysis – 10 December 2025

Qualcomm: ⬆️ Buy - Qualcomm broke strong resistance level 177.00 - Likely to rise to resistance…

3 hours ago

Novartis Wave Analysis – 10 December 2025

Novartis: ⬇️ Sell - Novartis reversed from strong resistance level 133.35 - Likely to fall to…

3 hours ago

EURCHF Wave Analysis – 10 December 2025

EURCHF: ⬇️ Sell - EURCHF reversed from resistance area - Likely to fall to support…

5 hours ago

CHFJPY Wave Analysis – 10 December 2025

CHFJPY: ⬆️ Buy - CHFJPY reversed from pivotal support level 192.60 - Likely to rise…

5 hours ago

The FOMC will take another route

While some central banks are signals end of easing cycle, the Fed intends to continue.…

9 hours ago

The crypto market is trying to break the downtrend

The crypto market rebounds as Bitcoin surges, although volatility and regulatory changes loom; forecasts for…

10 hours ago

This website uses cookies