Categories: Technical analysis

USDCHF Wave Analysis – 1 June, 2020

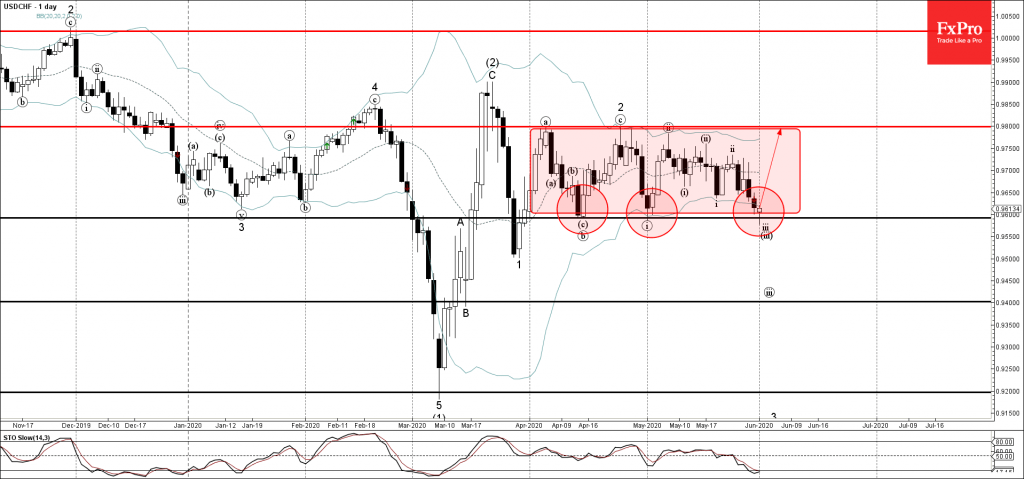
• USDCHF reversed from support level 0.9600

• Likely to rise to 0.9800

USDCHF recently reversed up from the key support level 0.9600 (low of the sideways price range from April), intersecting with the lower daily Bollinger band.

The upward reversal from the support level 0.9600 stopped the earlier short-term impulse wave (iii) – which belongs to the impulse wave 3 from the end of April.

Given the oversold reading on the daily Stochastic indicator – USDCHF is likely to rise further toward the next resistance level 0.9800 (upper boundary of this sideways price range).

The FxPro Tech Analysis Team

The FxPro technical experts prepare a daily analysis of the most active currency pairs (majors, crosses, exotics) and commodities. Selected instruments are reviewed on daily trends (D1, H4), using the active Elliott Wave setups, Japanese candlesticks, indicators, and support/resistance levels.

Share
Published by
The FxPro Tech Analysis Team
Tags: USDCHF

Recent Posts

Pro News Weekly: Market Shake-Up, Dollar Drops, Gold Surges, Bitcoin Wobbles!

Welcome to Pro News Flash! 💵 The U.S. dollar slips 🏆 Major stock indices struggle…

5 hours ago

Solana Wave Analysis – 5 December 2025

Solana: ⬇️ Sell - Solana reversed from resistance zone - Likely to fall to support…

6 hours ago

EURAUD Wave Analysis – 5 December 2025

EURAUD : ⬇️ Sell - EURAUD broke the support level 1.7600 - Likely to fall…

6 hours ago

Forex has set its priorities

In 2026, experts favour the yen, see modest euro growth, and expect pressure on the…

10 hours ago

Bear market rebound in crypto is likely to continue

Crypto rebounds continue; Bitcoin faces resistance, with a mixed market outlook ahead, as regulatory changes…

11 hours ago

Coca-Cola Wave Analysis – 4 December 2025

Coca-Cola: ⬇️ Sell - Coca-Cola reversed from long-term resistance level 73.25 - Likely to fall to…

1 day ago

This website uses cookies