Categories: Technical analysis

USDCHF Wave Analysis 1 April, 2021

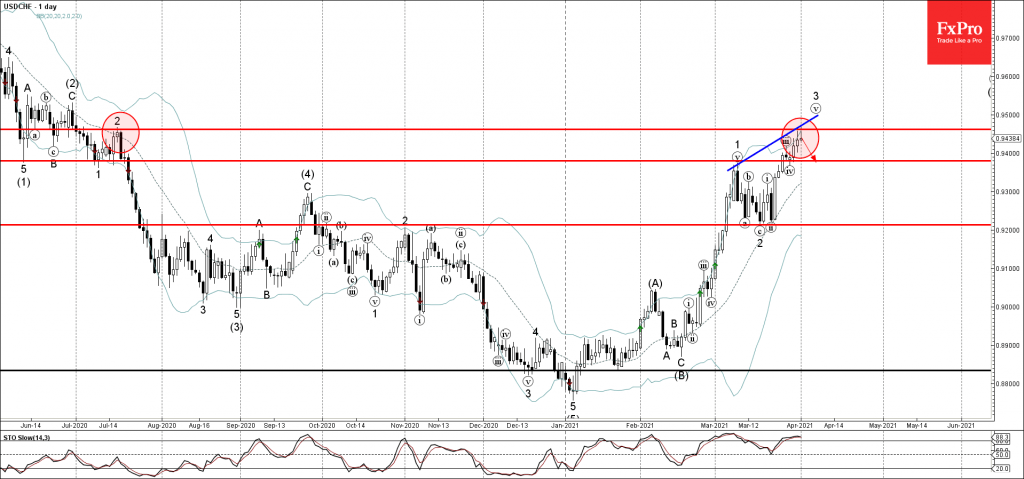
• USDCHF reversed from 0.9460

• Likely to fall to support level 0.9380

USDCHF recently reversed down from the long-term resistance level 0.9460 (former monthly high from July) – strengthened by the upper daily Bollinger Band.

The downward reversal from this resistance area stopped the previous upward impulse waves (v) and 3 of the sharp upward impulse wave (C) from February.

Given the bearish divergence on the daily Stochastic indictor, overbought daily Stochastic – USDCHF currency pair is likely to fall toward the next support level 0.9380 (former top of wave 1 from the start of March).

The FxPro Tech Analysis Team

The FxPro technical experts prepare a daily analysis of the most active currency pairs (majors, crosses, exotics) and commodities. Selected instruments are reviewed on daily trends (D1, H4), using the active Elliott Wave setups, Japanese candlesticks, indicators, and support/resistance levels.

Share
Published by
The FxPro Tech Analysis Team
Tags: USDCHF

Recent Posts

ANF Wave Analysis 29 April 2024

ANF reversed from key support level 113.40 Likely to rise to resistance level 132.31 ANF…

8 hours ago

GBPUSD Wave Analysis 29 April 2024

- GBPUSD rising inside minor correction 2 - Likely to rise to resistance level 1.2700…

8 hours ago

Crypto Market Retreats Due to Overhang of Sellers

Market picture The crypto market has lost 3.3% in the last 24 hours to $2.3…

18 hours ago

USDJPY Wave Analysis 26 April 2024

- USDJPY broke key resistance level 155.00 - Likely to rise to resistance level 160.00…

3 days ago

Ebay Wave Analysis 26 April 2024

- Ebay reversed from support level 49.35 - Likely to rise to resistance level 52.55…

3 days ago

False Alert with Yen Interventions?

Even though the Bank of Japan left the key rate and parameters of the QE…

4 days ago

This website uses cookies