Categories: Technical analysis

USDCHF Wave Analysis – 06 March, 2020

  • USDCHF broke support area
  • Likely to fall to 0.9250

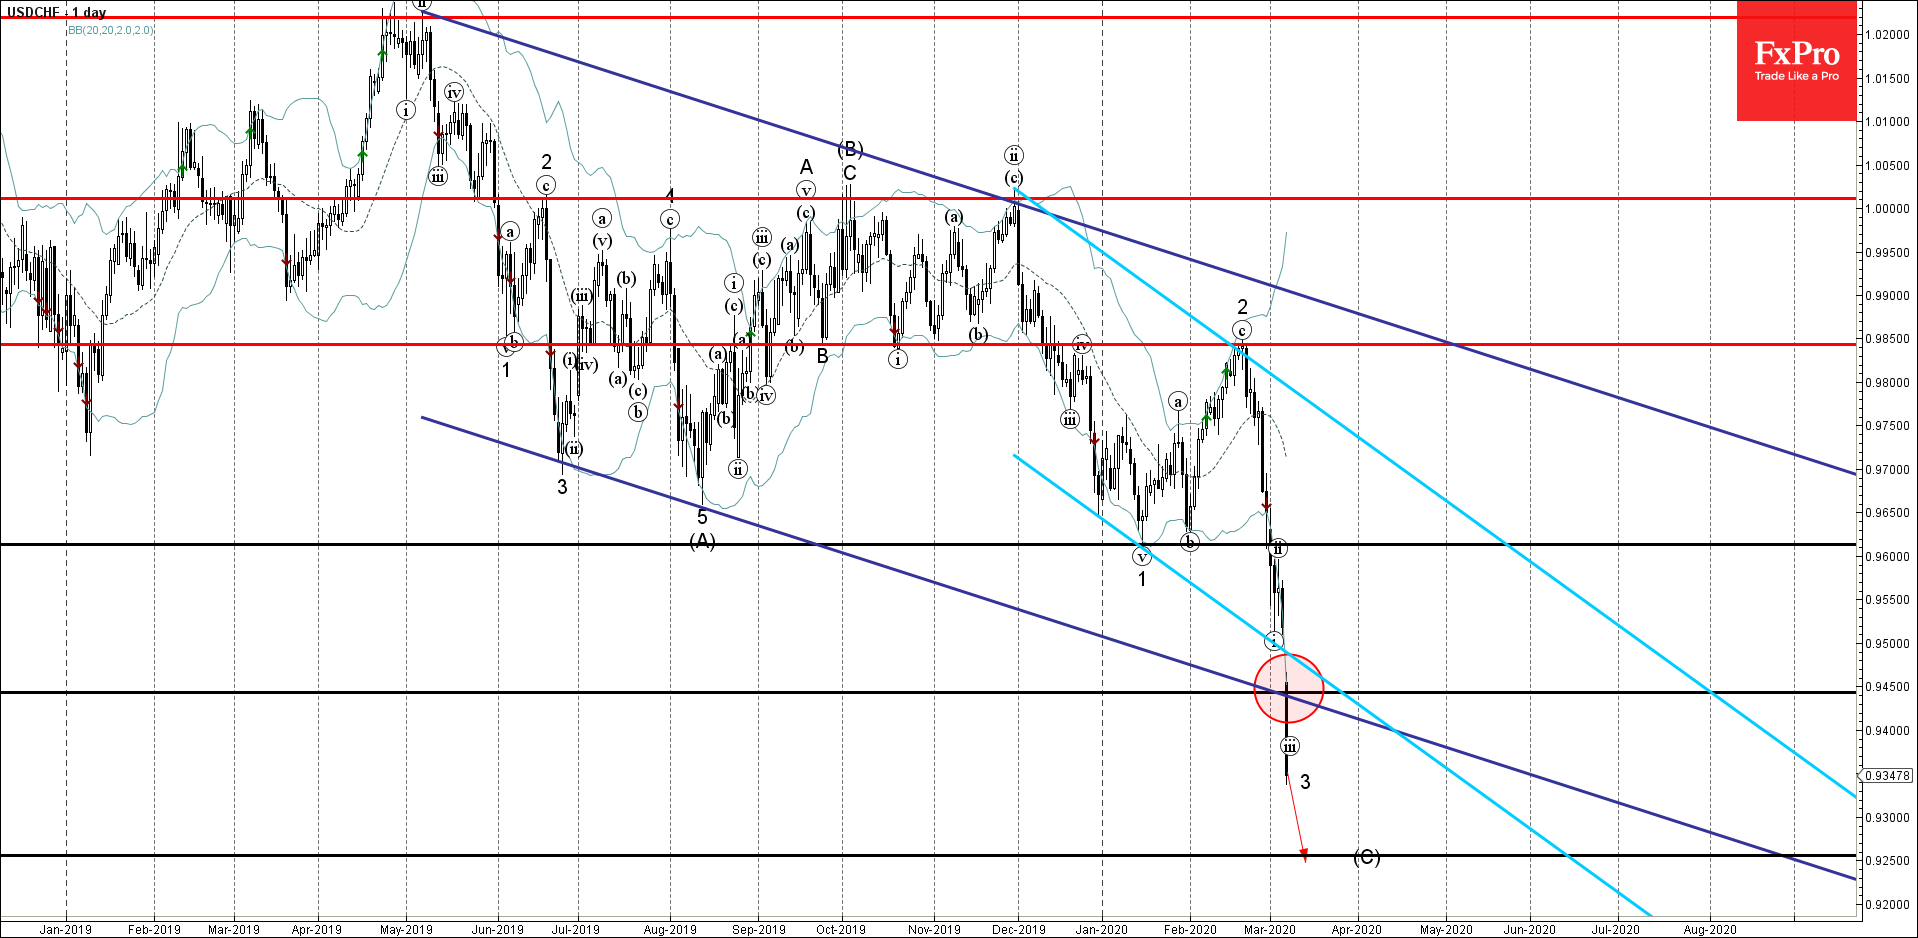
USDCHF recently broke sharply through the support area located between the support level 0.9450 and the support trendlines of the daily down channel from May and December.

The breakout of this support zone accelerated the active impulse waves 3 and (C).

USDCHF is likely fall toward the next support level 0.9250 (likely price for the completion of the active medium-term impulse wave (3)).

AddThis Website Tools
The FxPro Tech Analysis Team

The FxPro technical experts prepare a daily analysis of the most active currency pairs (majors, crosses, exotics) and commodities. Selected instruments are reviewed on daily trends (D1, H4), using the active Elliott Wave setups, Japanese candlesticks, indicators, and support/resistance levels.

Share
Published by
The FxPro Tech Analysis Team
Tags: USDCHF

Recent Posts

Apple Wave Analysis – 20 March 2025

Apple: ⬇️ Sell - Apple reversed from resistance level 220.00 - Likely to fall to…

2 hours ago

IBM Wave Analysis – 20 March 2025

IBM: ⬆️ Buy - IBM reversed from support zone - Likely to rise to resistance…

2 hours ago

AUDNZD Wave Analysis – 20 March 2025

AUDNZD: ⬆️ Buy - AUDNZD reversed from key support level 1.0930 - Likely to rise…

4 hours ago

EURCAD Wave Analysis – 20 March 2025

EURCAD: ⬇️ Sell - EURCAD reversed from the resistance zone - Likely to fall to…

4 hours ago

Crypto Market Testing Resistance

The crypto market has increased by over 5% and is nearing the $2.9 trillion. The…

9 hours ago

Gold Wave Analysis – 19 March 2025

Gold: ⬆️ Buy - Gold continues daily uptrend - Likely to rise to resistance level…

23 hours ago