Categories: Technical analysis

USDCHF Wave Analysis 16 October 2024

– USDCHF broke resistance zone

– Likely to rise to resistance level 0.8730

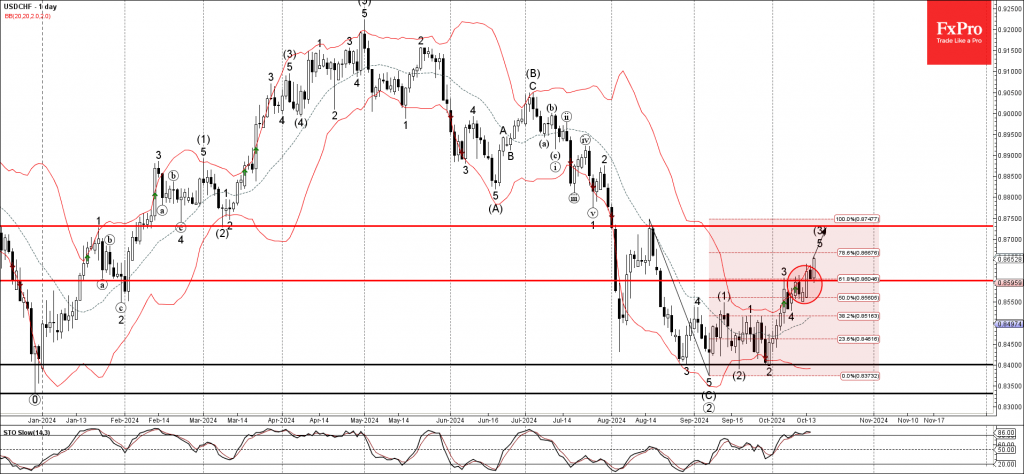
USDCHF currency pair recently broke the resistance zone between the resistance level 0.8600 (which stopped the previous impulse wave 3) and the 61.8% Fibonacci correction of the downward impulse from August.

The breakout of this resistance zone accelerated the minor impulse wave 5 of the higher order impulse wave (3) from September.

Given the continuation of the bullish US dollar sentiment, coupled with significant Swiss franc outflows, USDCHF currency pair  can be expected to rise further to the next resistance level 0.8730 (former monthly high from August).

The FxPro Tech Analysis Team

The FxPro technical experts prepare a daily analysis of the most active currency pairs (majors, crosses, exotics) and commodities. Selected instruments are reviewed on daily trends (D1, H4), using the active Elliott Wave setups, Japanese candlesticks, indicators, and support/resistance levels.

Share
Published by
The FxPro Tech Analysis Team
Tags: USDCHF

Recent Posts

CHFJPY Wave Analysis – 9 January 2026

CHFJPY: ⬆️ Buy - CHFJPY reversed from support area - Likely to rise to resistance…

13 hours ago

Exxon Mobil Wave Analysis – 9 January 2026

Exxon Mobil: ⬆️ Buy - Exxon Mobil reversed from support area - Likely to rise…

13 hours ago

Pro News Weekly: Dollar Rebounds as Markets Test New Limits

Welcome to Pro News Weekly! Here’s what is shaping the markets: 💵 The U.S. dollar…

17 hours ago

Geopolitics will destroy the euro

•    EURUSD falls due to geopolitics and expectations of tariff removal •    Gold returns to…

1 day ago

Platinum Wave Analysis – 8 January 2026

Platinum: ⬇️ Sell - Platinum reversed from pivotal resistance level 150.00 - Likely to fall to…

2 days ago

Baidu Wave Analysis – 8 January 2026

Baidu: ⬇️ Sell - Baidu reversed from resistance zone - Likely to fall to support level…

2 days ago

This website uses cookies