Categories: Technical analysis

USDCAD Wave Analysis 9 October 2024

– USDCAD broke the resistance zone

– Likely to rise to resistance level 1.3750

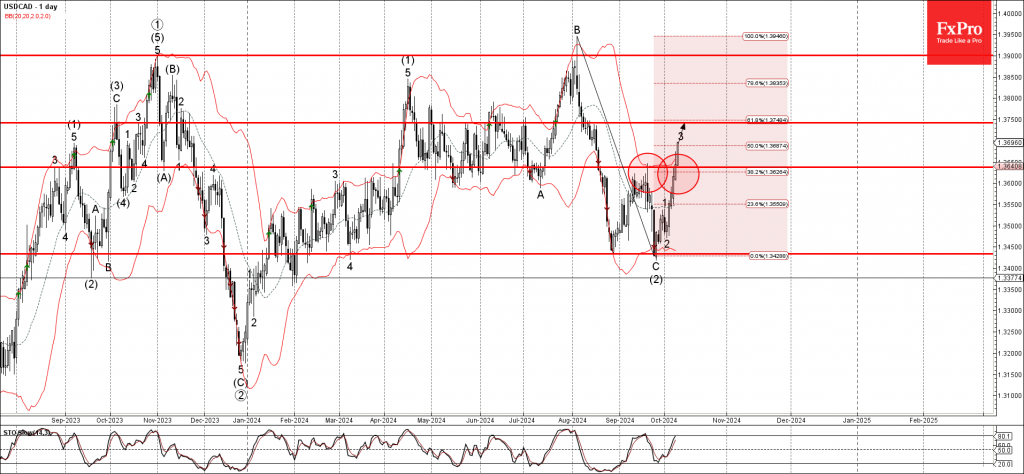
USDCAD currency pair recently broke the resistance zone located between the key resistance level 1.3635 (former monthly high from September) intersecting with the 38.2% Fibonacci correction of the downward wave C from August.

The breakout of this resistance zone strengthened the bullish pressure on this currency pair – accelerating the active impulse wave 3.

Given the strongly bullish US dollar sentiment seen today, USDCAD currency pair be expected to rise further to the next resistance level 1.3750, the target for the completion of the active impulse wave 3.

The FxPro Tech Analysis Team

The FxPro technical experts prepare a daily analysis of the most active currency pairs (majors, crosses, exotics) and commodities. Selected instruments are reviewed on daily trends (D1, H4), using the active Elliott Wave setups, Japanese candlesticks, indicators, and support/resistance levels.

Share
Published by
The FxPro Tech Analysis Team
Tags: USDCAD

Recent Posts

Gold Wave Analysis 9 October 2024

- Gold broke the support zone - Likely to fall support level 2580.00 Gold recently…

7 hours ago

RBNZ accelerated policy easing, knocking out NZD

The Reserve Bank of New Zealand cut its key interest rate by 50 basis points…

12 hours ago

The Crypto Maintains Its Equilibrium

The crypto market has stabilised around the $2.17 trillion level where it was a week…

18 hours ago

IBM Wave Analysis 8 October 2024

IBM broke resistance zone Likely to rise to resistance level 240.00 IBM continues to rise…

1 day ago

Nasdaq-100 Wave Analysis 8 October 2024

- Nasdaq-100 reversed from support zone - Likely to rise to resistance level 20340.00 Nasdaq-100…

1 day ago

Rising Treasury yields attract dollar interest

The Dollar Index has been rising since the end of September, tracking US long-term bond…

1 day ago

This website uses cookies