Categories: Technical analysis

USDCAD Wave Analysis 9 October 2023

– USDCAD reversed from resistance level 1.3800

– Likely to fall to support level 1.3555

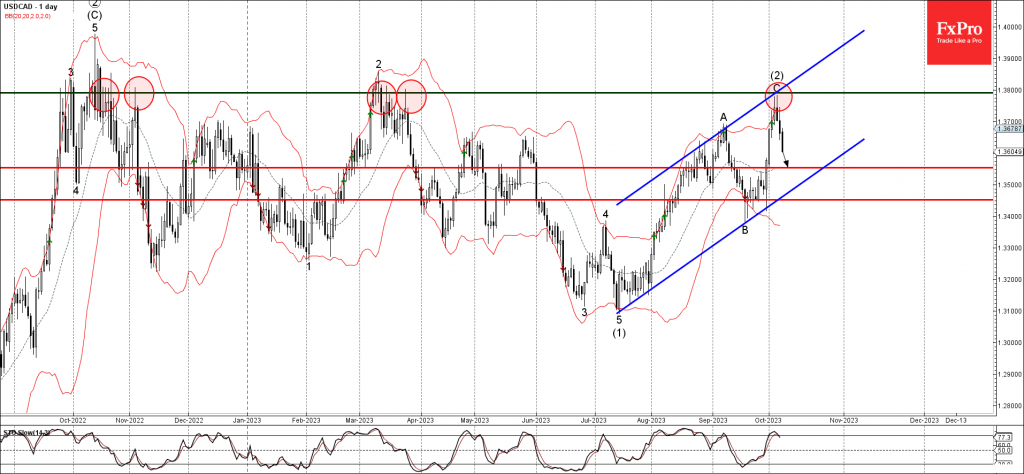
USDCAD currency pair recently reversed down from the resistance level 1.3800 (which has been reversing the price from October of 2022), coinciding with the upper daily Bollinger Band and the resistance trendline of the daily up channel from July.

The downward reversal from the resistance level 1.3800 stopped the c-wave of the earlier intermediate ABC correction (3) from the start of July.

Given the strength of the resistance level 1.3800 and the still overbought daily Stochastic, USDCAD can be expected to fall further toward the next support level 1.3555.

The FxPro Tech Analysis Team

The FxPro technical experts prepare a daily analysis of the most active currency pairs (majors, crosses, exotics) and commodities. Selected instruments are reviewed on daily trends (D1, H4), using the active Elliott Wave setups, Japanese candlesticks, indicators, and support/resistance levels.

Share
Published by
The FxPro Tech Analysis Team
Tags: USDCAD

Recent Posts

Weak Chinese data paves the way for lower yuan

Saturday's statistics from China added to fears of a slowdown in the world's second-largest economy,…

5 hours ago

A new local peak in crypto?

Market Picture The crypto market started the weekend on a positive note but has been…

11 hours ago

Fed rate decision: intrigue returns

Influential financial media are promoting the need for a 50-basis point rate cut. The Fed's…

2 days ago

GBPCAD Wave Analysis 13 September 2024

GBPCAD reversed from strong resistance level 1.7850 Likely to fall to support level 1.7700 GBPCAD…

3 days ago

Ebay Wave Analysis 13 September 2024

- Ebay broke resistance level 62.00   - Likely to rise to the resistance level…

3 days ago

Gold broke through the ceiling

After three weeks of consolidation, gold moved decisively upwards, hitting a record above $2572 per…

3 days ago

This website uses cookies