Categories: Technical analysis

USDCAD Wave Analysis 7 August 2024

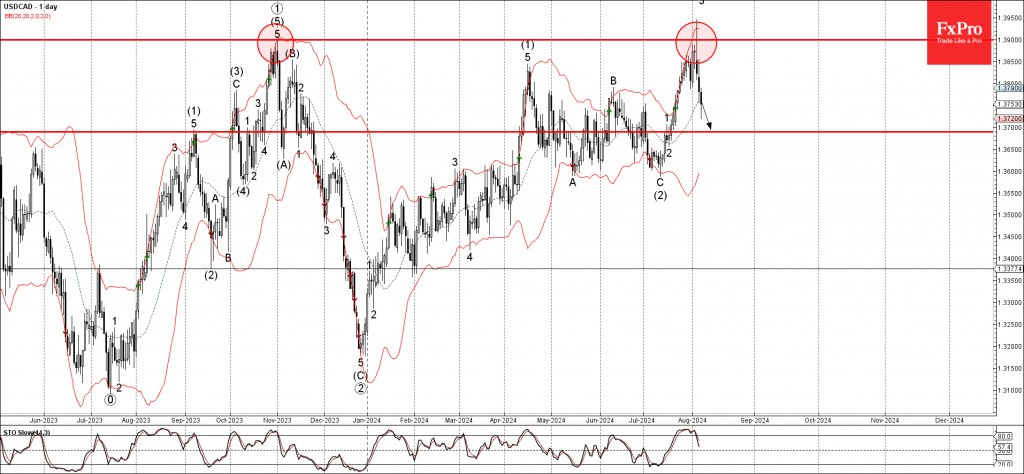
– USDCAD reversed from long-term resistance level 1.3900

– Likely to fall to support level 1.3700

USDCAD currency pair recently reversed down from the resistance zone located between the long-term resistance level 1.3900 (which stopped the weekly uptrend at the end of 2023) and the upper weekly Bollinger Band.

The downward reversal from the resistance zone created the weekly candlesticks reversal pattern Shooting Star Doji.

Given the strength of the resistance level 1.3900, USDCAD currency pair can be expected to fall further toward the next support level 1.3700.

The FxPro Tech Analysis Team

The FxPro technical experts prepare a daily analysis of the most active currency pairs (majors, crosses, exotics) and commodities. Selected instruments are reviewed on daily trends (D1, H4), using the active Elliott Wave setups, Japanese candlesticks, indicators, and support/resistance levels.

Share
Published by
The FxPro Tech Analysis Team
Tags: USDCAD

Recent Posts

EURJPY Wave Analysis 16 September 2024

- EURJPY reversed from support zone - Likely to rise to the resistance level 157.40…

10 hours ago

GBPUSD Wave Analysis 16 September 2024

- GBPUSD reversed from support zone - Likely to rise to the resistance level 1.3255…

10 hours ago

Weak Chinese data paves the way for lower yuan

Saturday's statistics from China added to fears of a slowdown in the world's second-largest economy,…

17 hours ago

A new local peak in crypto?

Market Picture The crypto market started the weekend on a positive note but has been…

23 hours ago

Fed rate decision: intrigue returns

Influential financial media are promoting the need for a 50-basis point rate cut. The Fed's…

2 days ago

GBPCAD Wave Analysis 13 September 2024

GBPCAD reversed from strong resistance level 1.7850 Likely to fall to support level 1.7700 GBPCAD…

3 days ago

This website uses cookies