Categories: Technical analysis

USDCAD Wave Analysis – 6 February 2025

– USDCAD reversed from the support zone

– Likely to rise to resistance level 1.4400

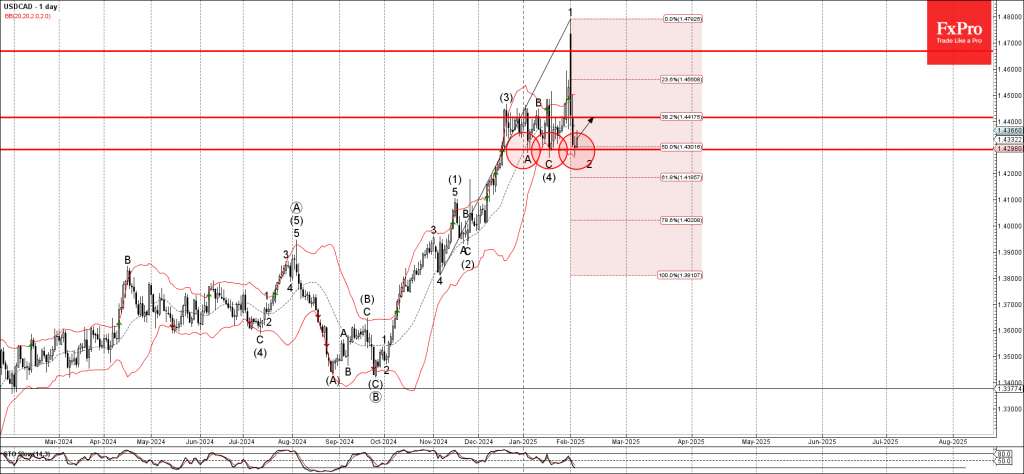
USDCAD currency pair recently reversed from the support zone between the pivotal support level 1.4290, which has stopped the previous corrections A, C , as can be seen below and the lower daily Bollinger Band.

The upward reversal from this support zone created the daily Japanese candlestick reversal pattern Doji, which stands near the 50% Fibonacci correction of the previous upward impulse from November.

Given the clear daily uptrend, USDCAD currency pair can be expected to rise to the next resistance level 1.4400.

The FxPro Tech Analysis Team

The FxPro technical experts prepare a daily analysis of the most active currency pairs (majors, crosses, exotics) and commodities. Selected instruments are reviewed on daily trends (D1, H4), using the active Elliott Wave setups, Japanese candlesticks, indicators, and support/resistance levels.

Share
Published by
The FxPro Tech Analysis Team
Tags: USDCAD

Recent Posts

Apple Wave Analysis – 9 April 2025

Apple: ⬆️ Buy - Apple reversed from the support zone - Likely to rise to…

15 hours ago

EURGBP Wave Analysis – 9 April 2025

EURGBP: ⬆️ Buy - EURGBP broke the resistance zone - Likely to rise to resistance…

15 hours ago

Dollar pressured as markets are betting on a dovish Fed

The selling pressure on the US dollar is due to the sell-off in equities and…

16 hours ago

The crypto market has returned to this week’s lows

Crypto market cap fell 2% to $2.46 trillion in 24 hours, retesting the $2.40 trillion…

19 hours ago

Video: Bitcoin in Crisis. Will Crypto Bounce Back or Crash?

Bitcoin’s struggle continues, and the market’s rebound might not last. But what’s really driving the…

23 hours ago

GBPCHF Wave Analysis – 8 April 2025

GBPCHF: ⬇️ Sell - GBPCHF broke the support zone - Likely to fall to support…

1 day ago

This website uses cookies