Categories: Technical analysis

USDCAD Wave Analysis 5 July 2024

– USDCAD reversed from powerful support level 1.3620

– Likely to rise to resistance level 1.3700

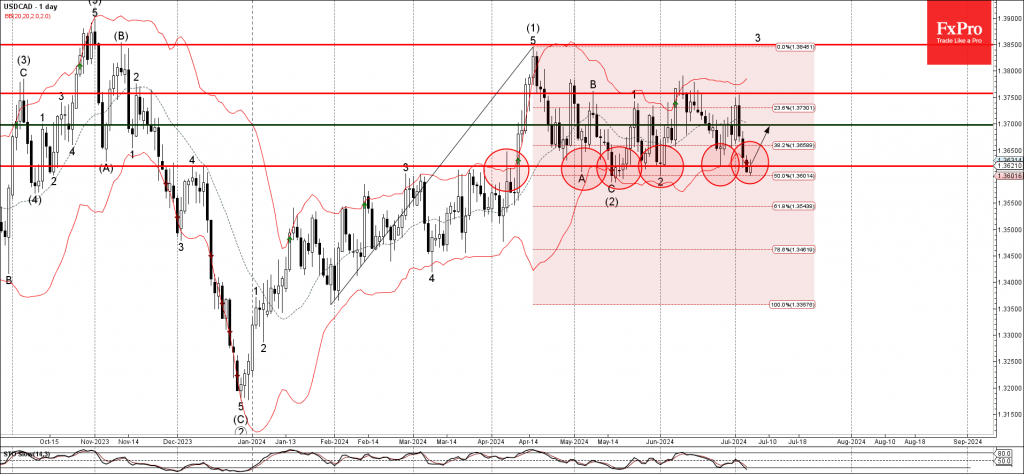
USDCAD currency pair just reversed up from the powerful support level 1.3620 (which has been steadily reversing the pair from the start of May).

The support level 1.2630 was strengthened by the lower daily Bollinger Band and by the 50% Fibonacci correction of the previous sharp upward impulse from January.

Given the clear daily uptrend, USDCAD currency pair can be expected to rise to the resistance level 1.3700.

AddThis Website Tools
The FxPro Tech Analysis Team

The FxPro technical experts prepare a daily analysis of the most active currency pairs (majors, crosses, exotics) and commodities. Selected instruments are reviewed on daily trends (D1, H4), using the active Elliott Wave setups, Japanese candlesticks, indicators, and support/resistance levels.

Share
Published by
The FxPro Tech Analysis Team
Tags: USDCAD

Recent Posts

Bitcoin Wave Analysis – 22 April 2025

Bitcoin: ⬆️ Buy - Bitcoin broke round resistance level 90000.00 - Likely to rise to…

43 minutes ago

AUDUSD Wave Analysis – 22 April 2025

AUDUSD: ⬇️ Sell - AUDUSD reversed from the key resistance level 0.6400 - Likely to…

44 minutes ago

Crypto Market Escapes from Fear

Market Overview The crypto market has gained around 2% over the past seven days, with…

13 hours ago

Nike Wave Analysis – 21 April 2025

Nike: ⬆️ Buy - Nike reversed from the long-term support level 52.60 - Likely to…

1 day ago

Natural Gas Wave Analysis – 21 April 2025

Natural gas: ⬇️ Sell Natural gas broke support area Likely to fall to support level…

1 day ago

EURUSD Wave Analysis – 21 April 2025

EURUSD: ⬆️ Buy - EURUSD broke the resistance area - Likely to test resistance level…

1 day ago