Categories: Technical analysis

USDCAD Wave Analysis 30 December 2024

– USDCAD reversed from resistance zone

– Likely to fall to support level 1.4400

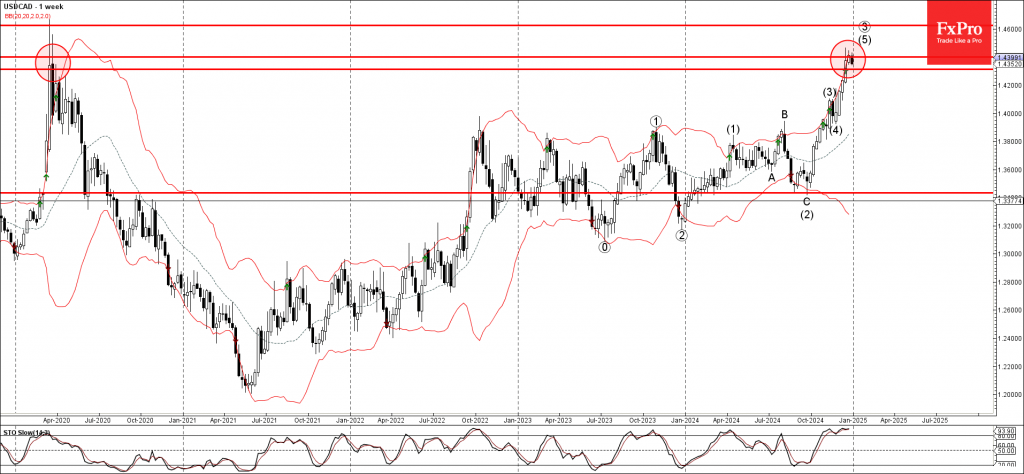
USDCAD currency pair recently reversed down from the resistance zone surrounding the major long-term resistance level 1.4400 (which stopped the sharp uptrend at the start of 2020) intersecting with the upper weekly Bollinger Band.

The downward reversal from the resistance level 1.4400 stopped the previous medium-term impulse wave (5).

Given the strength of the support level 1.4400 and the overbought reading on the weekly Stochastic indicator, USDCAD currency pair can be expected to fall to the next support level 1.4315.

AddThis Website Tools
The FxPro Tech Analysis Team

The FxPro technical experts prepare a daily analysis of the most active currency pairs (majors, crosses, exotics) and commodities. Selected instruments are reviewed on daily trends (D1, H4), using the active Elliott Wave setups, Japanese candlesticks, indicators, and support/resistance levels.

Share
Published by
The FxPro Tech Analysis Team
Tags: USDCAD

Recent Posts

Nikkei 225 Wave Analysis – 23 April 2025

Nikkei 225: ⬆️ Buy - Nikkei 225 broke the resistance area - Likely to rise…

7 hours ago

EURCHF Wave Analysis – 23 April 2025

EURCHF: ⬆️ Buy - EURCHF broke the resistance area - Likely to rise to resistance…

7 hours ago

CADJPY Wave Analysis – 23 April 2025

CADJPY: ⬆️ Buy - CADJPY reversed from strong support area - Likely to rise to…

9 hours ago

USDJPY Wave Analysis – 23 April 2025

USDJPY: ⬆️ Buy - USDJPY reversed from the support area - Likely to rise to…

9 hours ago

Europe’s Growth Stalls Again as the Euro Enters Correction Mode

Eurozone business activity slows as falling orders and declining confidence impact growth. Manufacturing PMI remains…

14 hours ago

The Rapid Assault on Crypto

The cryptocurrency market experienced a significant surge, with market capitalisation reaching $2.95 trillion. Bitcoin is…

17 hours ago