Categories: Technical analysis

USDCAD Wave Analysis 3 September 2024

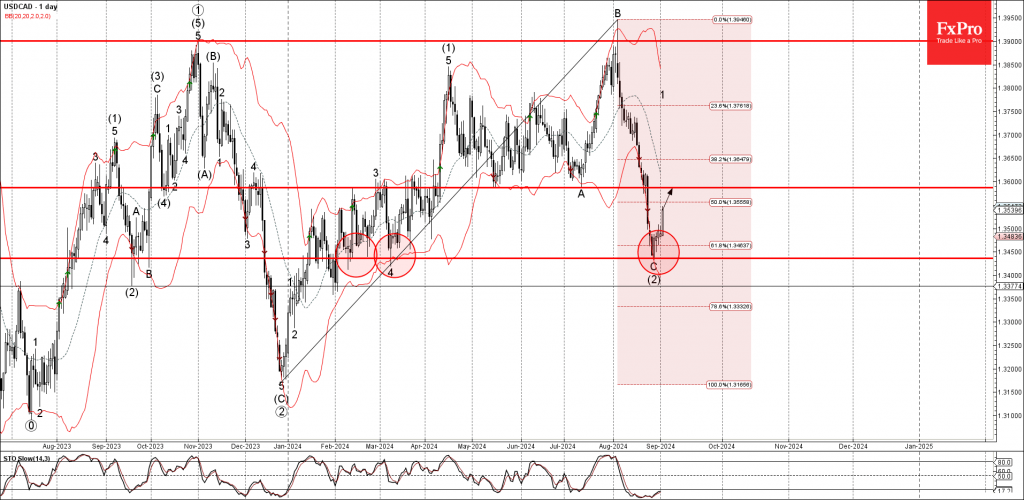
– USDCAD reversed from key support level 1.3450

– Likely to rise to resistance level 1.3600

USDCAD currency pair recently reversed up from the key support level 1.3450 (which has been reversing the price from February) standing near the lower daily Bollinger Band.

The upward reversal from the support level 1.3450 stopped the previous primary ABC correction (2).

Given the oversold daily Stochastic, USDCAD currency pair can be expected to rise further to the next resistance level 1.3600, former monthly low from July.

The FxPro Tech Analysis Team

The FxPro technical experts prepare a daily analysis of the most active currency pairs (majors, crosses, exotics) and commodities. Selected instruments are reviewed on daily trends (D1, H4), using the active Elliott Wave setups, Japanese candlesticks, indicators, and support/resistance levels.

Share
Published by
The FxPro Tech Analysis Team
Tags: USDCAD

Recent Posts

The Fed’s big rate and projections cut

The Fed cut the rate by 50 bps, This change was not fully factored into…

1 hour ago

Crypto market climbs out of the pit

The crypto market as a whole and Bitcoin hit three-week highs, but are still in…

8 hours ago

AUDCAD Wave Analysis 18 September 2024

- AUDCAD broke pivotal resistance level 0.9170 - Likely to rise to resistance level 0.9260…

21 hours ago

WTI Wave Analysis 18 September 2024

- WTI reversed from round resistance level 70.00 - Likely to fall to support level…

21 hours ago

Strong data didn’t derail markets from expectations of a 50bp Fed cut

US retail sales rose 0.1% m/m in August, better than forecast, but sales growth in…

1 day ago

The crypto market gets a boost from stocks

Market Picture The crypto market has gained 2.1% in the last 24 hours to reach…

1 day ago

This website uses cookies