Categories: Technical analysis

USDCAD Wave Analysis 3 January 2024

– USDCAD reversed from key support level 1.3200

– Likely to rise to resistance level 1.3400

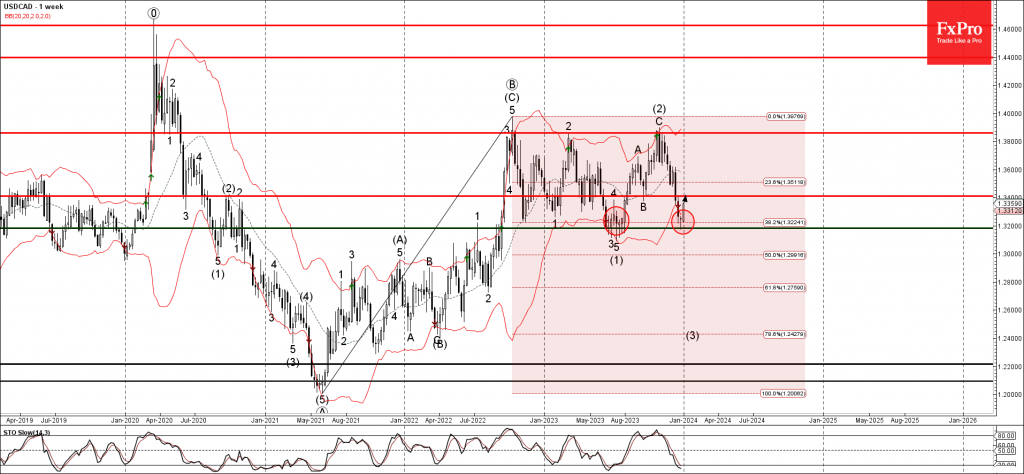
USDCAD currency pair recently reversed up from the key support level 1.3200 (which reversed the price multiples times in the middle of 2023, as can be seen below).

The support level 1.3200 was further strengthened by the lower daily Bollinger Band and by the 38.2% Fibonacci correction of the upward impulse from 2021.

Given the strongly bullish dollar sentiment seen today, USDCAD can be expected to rise further to the next resistance level 1.3400 (former low of wave B from last year).

The FxPro Tech Analysis Team

The FxPro technical experts prepare a daily analysis of the most active currency pairs (majors, crosses, exotics) and commodities. Selected instruments are reviewed on daily trends (D1, H4), using the active Elliott Wave setups, Japanese candlesticks, indicators, and support/resistance levels.

Share
Published by
The FxPro Tech Analysis Team
Tags: USDCAD

Recent Posts

Brent Crude oil Wave Analysis – 13 January 2026

Brent Crude oil ⬆️ Buy - Brent Crude oil rising inside impulse wave c -…

2 hours ago

USDJPY Wave Analysis – 13 January 2026

USDJPY ⬆️ Buy - USDJPY broke resistance area - Likely to rise to resistance level…

2 hours ago

Exxon Mobil Wave Analysis – 13 January 2026

Exxon Mobil ⬆️ Buy - Exxon Mobil broke resistance level 125.60 - Likely to rise…

2 hours ago

BNB Wave Analysis – 13 January 2026

Brent Crude oil ⬆️ Buy - BNB broke out of sideways price range - Likely…

2 hours ago

A slightly weaker CPI was not enough to break through the highs

US CPI data a bit softer than forecasts, sparking brief market optimism, but resistance remains.…

8 hours ago

Pro News Flash: Global Tensions Fuel a Fresh Oil Rally

🛢️ Oil prices are finding fresh strength as geopolitical tensions in the Middle East reignite…

8 hours ago

This website uses cookies