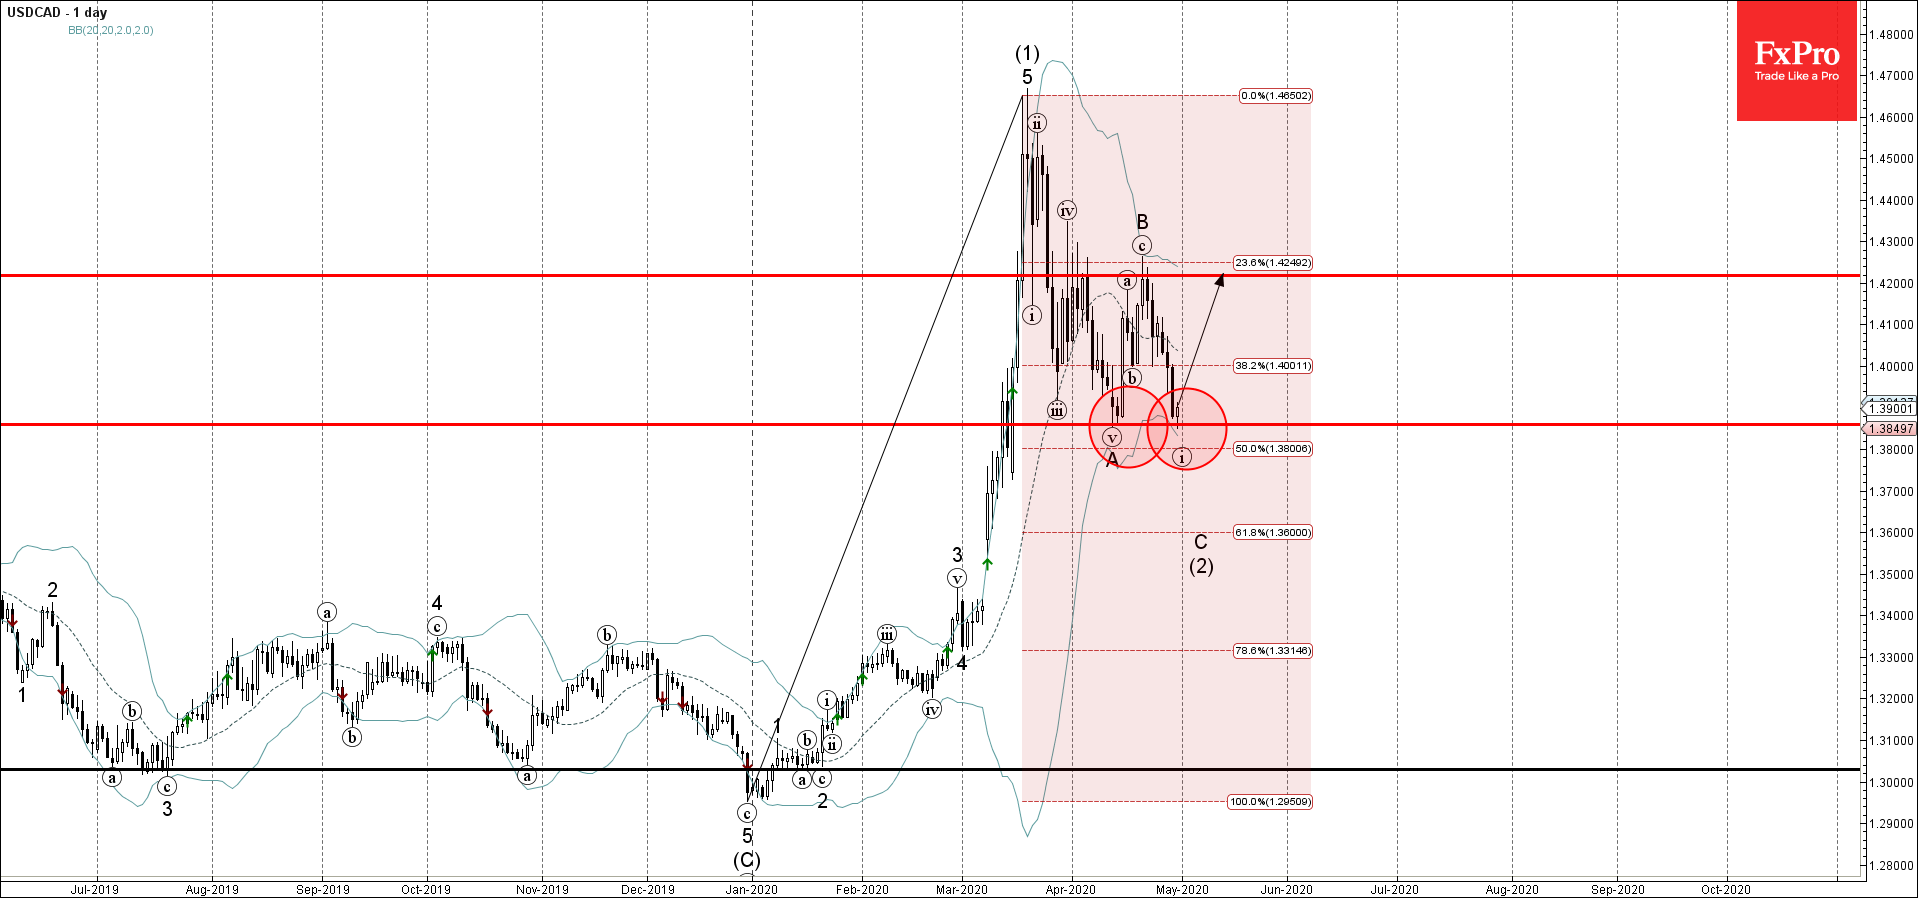
- USDCAD reversed from support area
- Likely to rise to 1.4220
USDCAD today reversed up from the support area lying between the key support level 1.3860 (low of the previous wave A), lower daily Bollinger Band and the 50% Fibonacci retracement of the previous sharp upward impulse (1) from December.
The upward reversal from this support area stopped the earlier short-term impulse wave (i) which belong to the C-wave from the middle of April.
USDCAD is expected to rise further toward the next resistance level 1.4220 (which reversed earlier waves (a) and B).