Categories: Technical analysis

USDCAD Wave Analysis – 28 August 2025

USDCAD: ⬇️ Sell

– USDCAD broke daily up channel

– Likely to fall to support level 1.3715

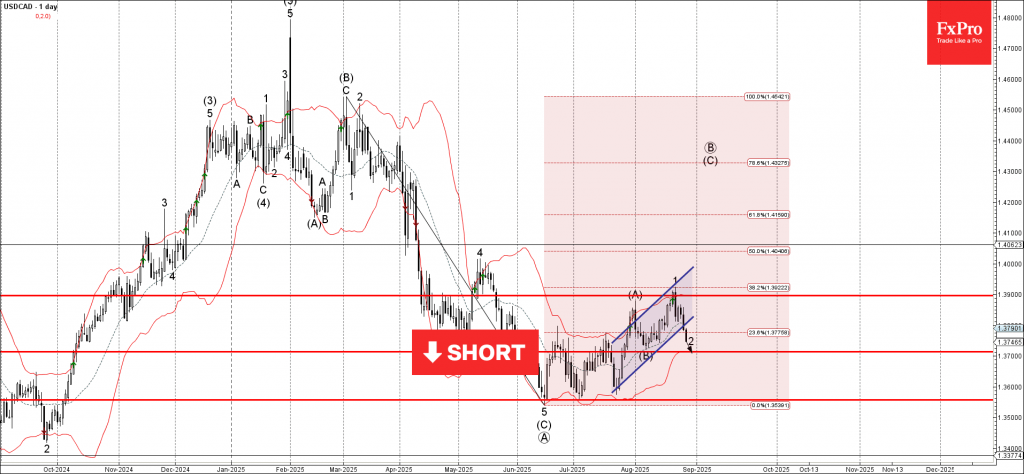
USDCAD currency pair recently reversed down from the resistance zone between the resistance level 1.3900, upper daily Bollinger Band and the 38.2% Fibonacci correction of the downward impulse from February.

The price just broke the support trendline of the daily up channel from July – which should accelerate the active wave 2.

Given the clear daily downtrend, USDCAD currency pair can be expected to fall to the next support level 1.3715 (target price for the completion of the active wave 2).

The FxPro Tech Analysis Team

The FxPro technical experts prepare a daily analysis of the most active currency pairs (majors, crosses, exotics) and commodities. Selected instruments are reviewed on daily trends (D1, H4), using the active Elliott Wave setups, Japanese candlesticks, indicators, and support/resistance levels.

Share
Published by
The FxPro Tech Analysis Team
Tags: USDCAD

Recent Posts

CADJPY Wave Analysis – 26 December 2025

CADJPY: ⬆️ Buy - CADJPY broke resistance level 114.30 - Likely to rise to resistance…

9 hours ago

Toncoin Wave Analysis – 26 December 2025

Toncoin: ⬆️ Buy - Toncoin reversed from support zone - Likely to rise to resistance…

9 hours ago

Nvidia Wave Analysis – 26 December 2025

Nvidia: ⬆️ Buy - Nvidia reversed from support zone - Likely to rise to resistance…

9 hours ago

Palladium Wave Analysis – 26 December 2025

Palladium: ⬆️ Buy - Palladium reversed from support zone - Likely to rise to resistance…

9 hours ago

AUDUSD Wave Analysis – 24 December 2025

AUDUSD: ⬆️ Buy - AUDUSD broke key resistance level 0.6690 - Likely to rise to…

3 days ago

Tron Wave Analysis – 24 December 2025

Tron: ⬇️ Sell - Tron reversed from resistance zone - Likely to fall to support…

3 days ago

This website uses cookies