Categories: Technical analysis

USDCAD Wave Analysis – 26 November 2025

USDCAD: ⬇️ Sell

– USDCAD reversed from resistance area

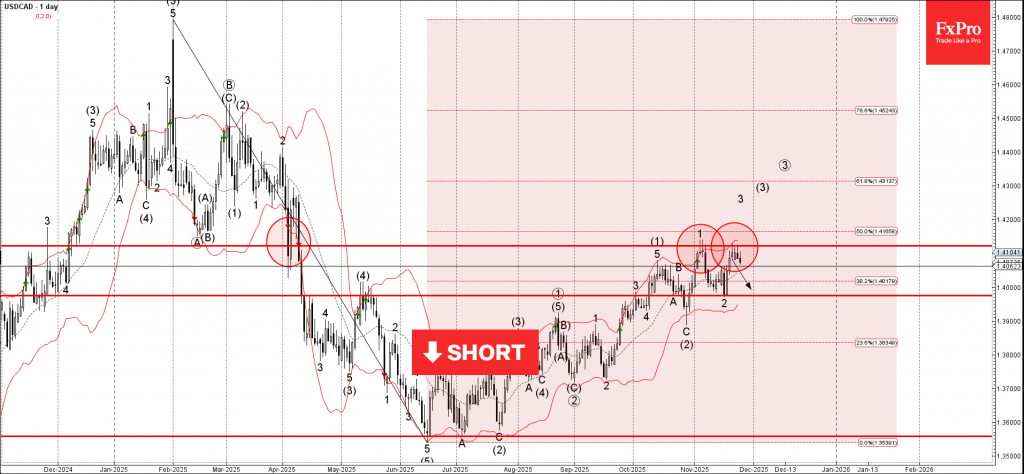
– Likely to fall to support level 1.3975

USDCAD currency pair recently reversed from resistance area between the pivotal resistance level 1.4125 (which has been reversing the price from April), upper daily Bollinger Band and the 50% Fibonacci correction of the downward impulse from January.

The downward reversal from this resistance area stopped the previous impulse waves 3 and (3).

Given the strength of the resistance level 1.4125, USDCAD can be expected to fall to the next support level 1.3975 (low of the previous correction 2).

The FxPro Tech Analysis Team

The FxPro technical experts prepare a daily analysis of the most active currency pairs (majors, crosses, exotics) and commodities. Selected instruments are reviewed on daily trends (D1, H4), using the active Elliott Wave setups, Japanese candlesticks, indicators, and support/resistance levels.

Share
Published by
The FxPro Tech Analysis Team
Tags: USDCAD

Recent Posts

EURAUD Wave Analysis – 6 January 2026 Wave Analysis – 6 January 2026

EURAUD: ⬇️ Sell - EURAUD broke strong support level 1.7465 - Likely to fall to…

1 hour ago

IBM Wave Analysis – 6 January 2026

IBM: ⬆️ Buy - IBM reversed from support zone - Likely to rise to resistance…

1 hour ago

Palladium Wave Analysis – 6 January 2026

Palladium: ⬆️ Buy - Palladium reversed from round support level 1600.00 - Likely to rise…

1 hour ago

Amazon Wave Analysis – 6 January 2026

Amazon: ⬆️ Buy - Amazon broke resistance zone - Likely to rise to resistance level…

1 hour ago

Pro News Flash: Gold Bulls Take Control

🥇 Gold is regaining momentum as investors lean into geopolitics, a softer US dollar and…

7 hours ago

The dollar is forced to retreat

• The reduction in geopolitical risks in Venezuela has weakened the greenback. •  Precious metal investors…

11 hours ago

This website uses cookies