Categories: Technical analysis

USDCAD Wave Analysis 23 April 2024

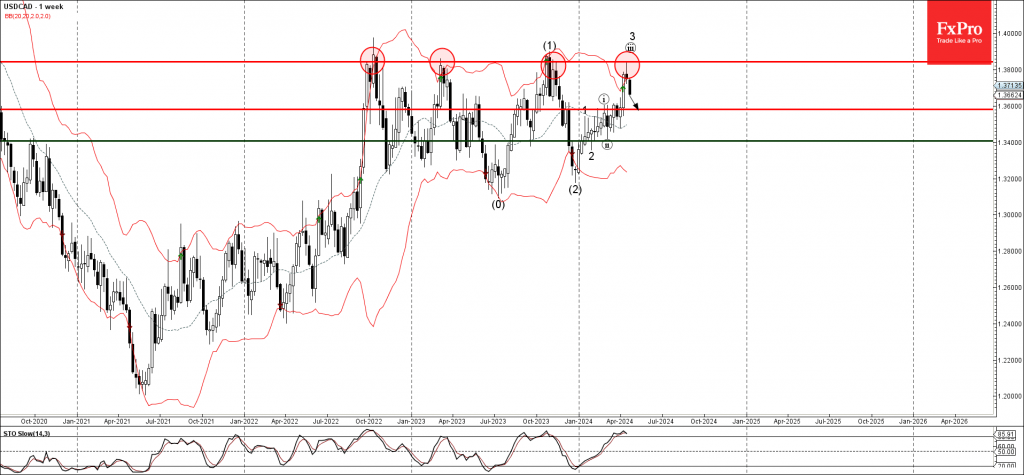
– USDCAD reversed from long-term resistance level 1.3840

– Likely to fall to support level 1.3600

USDCAD currency pair continues to fall after the pair reversed down with the weekly Shooting Star from the major long-term resistance level 1.3840, which has been reversing the pair from 2022.

The resistance level 1.3840 was strengthened by the upper weekly Bollinger Band.

Give the overbought weekly Stochastic, USDCAD currency pair can be expected to fall further to the next support level 1.3600.

AddThis Website Tools
The FxPro Tech Analysis Team

The FxPro technical experts prepare a daily analysis of the most active currency pairs (majors, crosses, exotics) and commodities. Selected instruments are reviewed on daily trends (D1, H4), using the active Elliott Wave setups, Japanese candlesticks, indicators, and support/resistance levels.

Share
Published by
The FxPro Tech Analysis Team
Tags: USDCAD

Recent Posts

Adobe Wave Analysis – 13 March 2025

Adobe: ⬇️ Sell - Adobe broke round support level 400.00 - Likely to fall to…

2 hours ago

Apple Wave Analysis – 13 March 2025

Apple: ⬇️ Sell - Apple broke support area - Likely to fall to support level…

2 hours ago

Gold Wave Analysis – 13 March 2025

Gold: ⬆️ Buy - Gold broke resistance level 2962.00 - Likely to rise to resistance…

3 hours ago

EURGBP Wave Analysis – 13 March 2025

EURGBP: ⬇️ Sell - EURGBP reversed from key resistance level 0.8450 - Likely to fall…

3 hours ago

Gold climbs on lower rate speculations

The gold price has resumed updating its all-time highs on the back of speculations around…

9 hours ago

Crypto: just a bumpy downtrend

The crypto market experienced a drop, but towards the end of the week, there was…

10 hours ago