Categories: Technical analysis

USDCAD Wave Analysis 22 May 2024

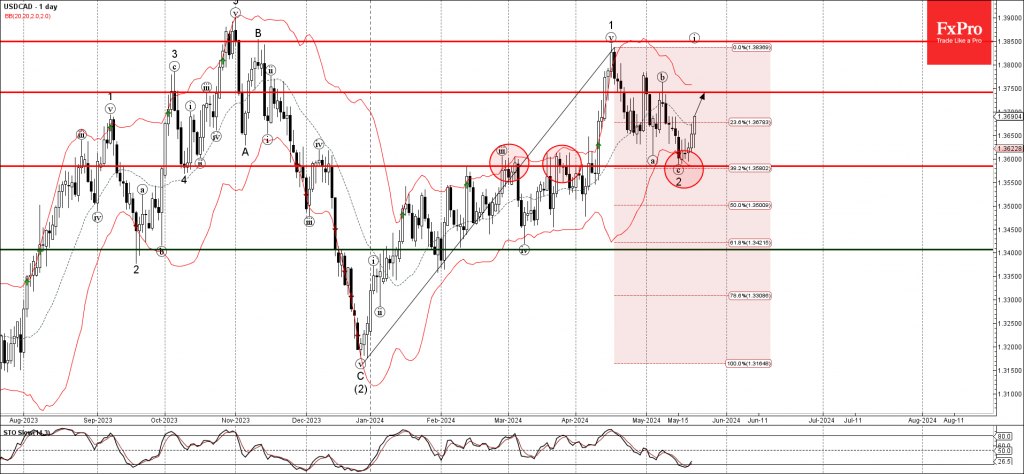
– USDCAD reversed from pivotal support level 1.3585

– Likely to rise to resistance level 1.3750


USDCAD currency pair recently reversed up from the pivotal support level 1.3585 (former strong resistance from December, February and March) intersecting with the lower daily Bollinger Band and the 38.2% Fibonacci correction of the upward impulse from December.

The upward reversal from the support level 1.3585 stopped the previous minor ABC correction 2.

Given the strength of the support level 1.3585, USDCAD currency pair can be expected to rise further to the next resistance level 1.3750.

The FxPro Tech Analysis Team

The FxPro technical experts prepare a daily analysis of the most active currency pairs (majors, crosses, exotics) and commodities. Selected instruments are reviewed on daily trends (D1, H4), using the active Elliott Wave setups, Japanese candlesticks, indicators, and support/resistance levels.

Share
Published by
The FxPro Tech Analysis Team
Tags: USDCAD

Recent Posts

CADCHF Wave Analysis 27 September 2024

CADCHF reversed from resistance level 0.6320 Likely to fall to support level 0.6180 CADCHF currency…

24 hours ago

Telsa Wave Analysis 27 September 2024

- Telsa broke daily up channel - Likely to rise to resistance level 268.50 Telsa…

24 hours ago

The wild part of the gold rally

Gold has hit all-time highs on each of the last six trading days, reaching $2685.…

1 day ago

The crypto market and Bitcoin break the months-long downtrend

The cryptocurrency market has surpassed previous highs to reach $2.29 trillion, confirming the break of…

2 days ago

Alibaba Group Wave Analysis 26 September 2024

- Alibaba Group broke resistance zone - Likely to rise to resistance level 120.00 Alibaba…

2 days ago

EURJPY Wave Analysis 26 September 2024

- EURJPY rising inside minor impulse wave 3 - Likely to reach resistance level 162.8…

2 days ago

This website uses cookies