Categories: Technical analysis

USDCAD Wave Analysis – 21 November, 2019

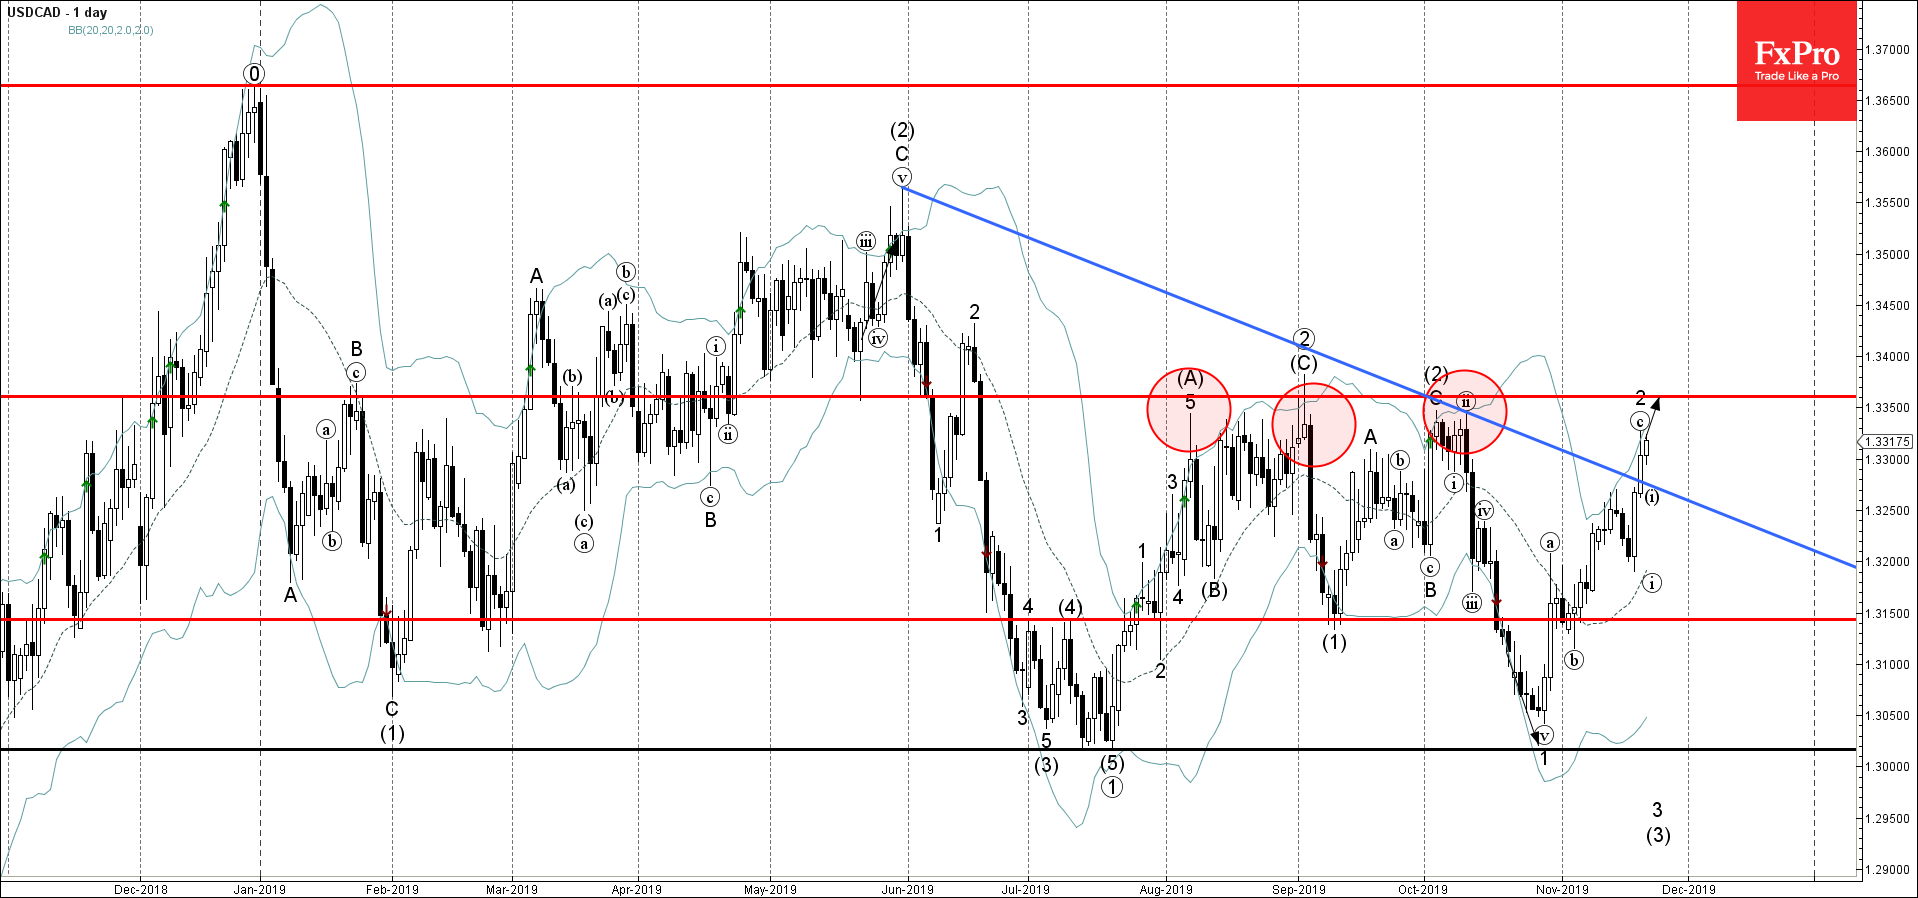
  • USDCAD broke resistance trendline
  • Likely to rise to 1.3300

USDCAD recently broke though the resistance trendline from the end of May – which accelerated the active impulse wave C of the ABC correction 2.

The active wave 2 is a part of the longer-term downward impulse sequence (3) from May.

USDCAD is expected to rise further toward the next strong resistance level 1.3300 (which has been reversing the price from August, target price for the completion of the active ABC correction 2).

The FxPro Tech Analysis Team

The FxPro technical experts prepare a daily analysis of the most active currency pairs (majors, crosses, exotics) and commodities. Selected instruments are reviewed on daily trends (D1, H4), using the active Elliott Wave setups, Japanese candlesticks, indicators, and support/resistance levels.

Share
Published by
The FxPro Tech Analysis Team
Tags: USDCAD

Recent Posts

EURJPY Wave Analysis – 31 December 2025

EURJPY: ⬆️ Buy - EURJPY reversed from support area - Likely to rise to resistance…

2 days ago

Binance Coin Wave Analysis – 31 December 2025

Binance Coin: ⬆️ Buy - Binance Coin broke Descending Triangle - Likely to rise to…

2 days ago

Uniswap Wave Analysis – 31 December 2025

Uniswap: ⬇️ Sell - Uniswap reversed from resistance area - Likely to fall to support…

2 days ago

S&P 500 Wave Analysis – 31 December 2025

S&P 500: ⬇️ Sell - S&P 500 reversed from strong resistance level 6935.00 - Likely…

2 days ago

The dollar may defy expectations

•  The return of American exceptionalism will help the greenback. •  The yen will start…

2 days ago

Stellar Wave Analysis – 30 December 2025

Stellar: ⬇️ Sell - Stellar reversed from resistance area - Likely to fall to support…

2 days ago

This website uses cookies