Categories: Technical analysis

USDCAD Wave Analysis – 21 November, 2019

  • UPS falling inside impulse wave C
  • Likely to fall to 1.3300

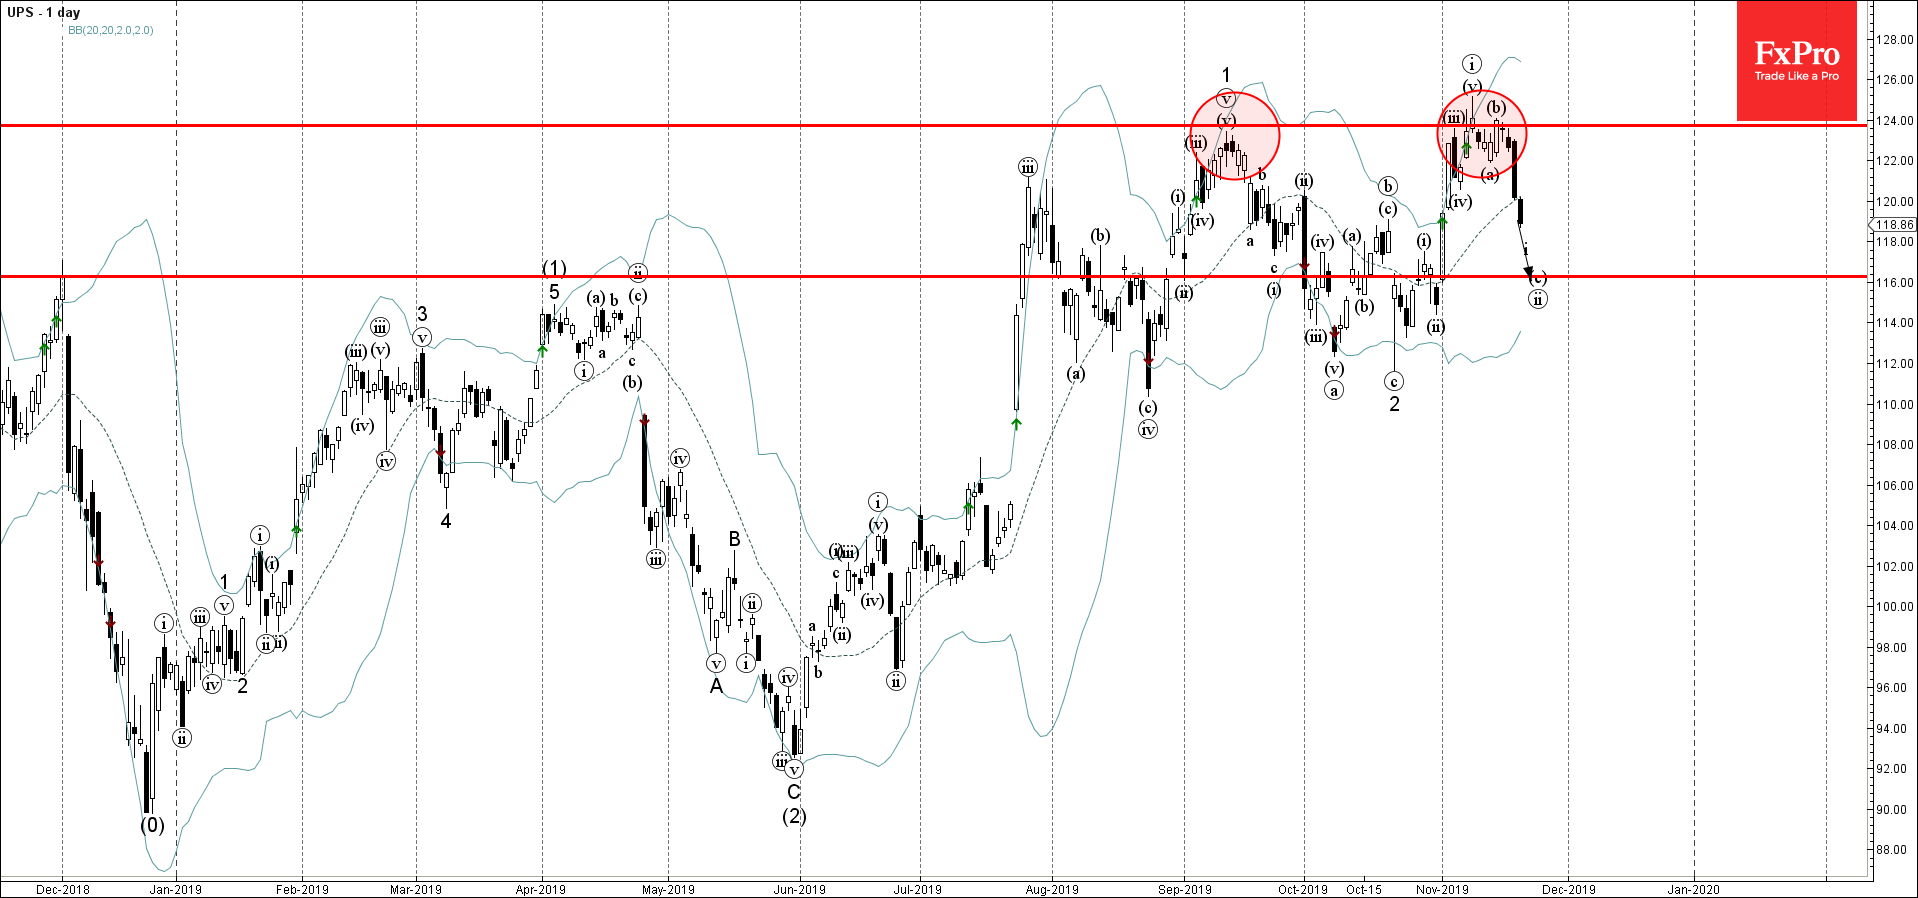
UPS continues to fall inside the sharp impulse wave C of the short-term ABC correction (ii) from the start of November.

Wave (ii) started earlier from the combined resistance area lying between the resistance level 124.00 (top of wave 1 from September) and the upper daily Bollinger Band.

UPS is expected to fall further toward the next support level 116.00 (forecast price for the completion of the active ABC correction 2).

AddThis Website Tools
The FxPro Tech Analysis Team

The FxPro technical experts prepare a daily analysis of the most active currency pairs (majors, crosses, exotics) and commodities. Selected instruments are reviewed on daily trends (D1, H4), using the active Elliott Wave setups, Japanese candlesticks, indicators, and support/resistance levels.

Share
Published by
The FxPro Tech Analysis Team
Tags: UPS

Recent Posts

S&P 500 Wave Analysis – 1 April 2025

S&P 500: ⬆️ Buy - S&P 500 reversed from support area - Likely to rise…

5 hours ago

GBPAUD Wave Analysis – 1 April 2025

GBPAUD: ⬇️ Sell - GBPAUD reversed from long-term resistance level 2.0820 - Likely to fall…

5 hours ago

Crypto’s Attempt to Stabilise

The cryptocurrency market has experienced some volatility, with a 1.1% rise in 24 hours and…

17 hours ago

NIO Wave Analysis – 31 March 2025

NIO: ⬆️ Buy - NIO reversed from support zone - Likely to rise to resistance…

1 day ago

Nvidia Wave Analysis – 31 March 2025

Nvidia: ⬆️ Buy - Nvidia reversed from key support level 105.00 - Likely to rise…

1 day ago

Markets rattled on consumer sentiment

Consumer sentiment index from the University of Michigan shows alarming information for stock indices, with…

1 day ago