Categories: Technical analysis

USDCAD Wave Analysis – 19 September, 2022

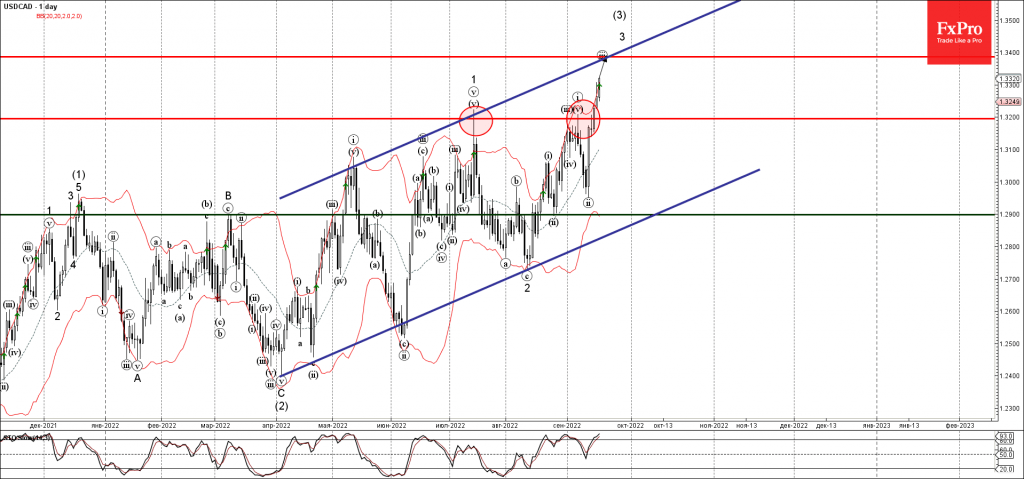
• USDCAD broke key resistance level 1.3200

• Likely to rise to resistance level 1.3400

USDCAD currency pair under the bullish pressure after the price broke above the key resistance level 1.3200 (which has been reversing the pair from July, as can be seen below).

The breakout of the resistance level 1.3200 accelerated the active short-term impulse wave 3, which belongs to the intermediate impulse wave (3) from April.

Given the clear uptrend, strong CAD sales on oil losses, USDCAD can be expected to rise further toward the next resistance level 1.3400 (intersecting with the up channel from April, target for the end of minor wave (iii)).

The FxPro Tech Analysis Team

The FxPro technical experts prepare a daily analysis of the most active currency pairs (majors, crosses, exotics) and commodities. Selected instruments are reviewed on daily trends (D1, H4), using the active Elliott Wave setups, Japanese candlesticks, indicators, and support/resistance levels.

Share
Published by
The FxPro Tech Analysis Team
Tags: USDCAD

Recent Posts

CHFJPY Wave Analysis – 9 January 2026

CHFJPY: ⬆️ Buy - CHFJPY reversed from support area - Likely to rise to resistance…

1 day ago

Exxon Mobil Wave Analysis – 9 January 2026

Exxon Mobil: ⬆️ Buy - Exxon Mobil reversed from support area - Likely to rise…

1 day ago

Pro News Weekly: Dollar Rebounds as Markets Test New Limits

Welcome to Pro News Weekly! Here’s what is shaping the markets: 💵 The U.S. dollar…

1 day ago

Geopolitics will destroy the euro

•    EURUSD falls due to geopolitics and expectations of tariff removal •    Gold returns to…

2 days ago

Platinum Wave Analysis – 8 January 2026

Platinum: ⬇️ Sell - Platinum reversed from pivotal resistance level 150.00 - Likely to fall to…

2 days ago

Baidu Wave Analysis – 8 January 2026

Baidu: ⬇️ Sell - Baidu reversed from resistance zone - Likely to fall to support level…

2 days ago

This website uses cookies