Categories: Technical analysis

USDCAD Wave Analysis – 19 May, 2020

• USDCAD broke support level 1.3915

• Likely to fall to 1.3835

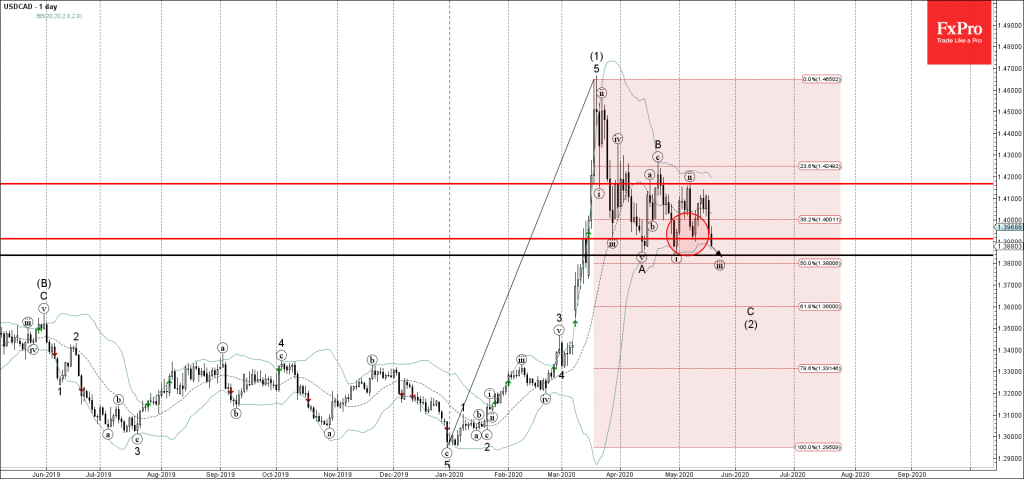
USDCAD today broke the key support level 1.3915 (low of the previous Bullish Engulfing from the start of May), – which follows the breakout of the 38.2% Fibonacci correction of the previous upward impulse (1) from December.

The breakout of the support level 1.3915 continues the active short-term impulse wave (iii)- which belongs to wave C of the medium-term ABC correction (2) from March. USDCAD is likely to fall further toward the next support level 1.3835 (which reversed the earlier waves A and (i)).

The FxPro Tech Analysis Team

The FxPro technical experts prepare a daily analysis of the most active currency pairs (majors, crosses, exotics) and commodities. Selected instruments are reviewed on daily trends (D1, H4), using the active Elliott Wave setups, Japanese candlesticks, indicators, and support/resistance levels.

Share
Published by
The FxPro Tech Analysis Team
Tags: USDCAD

Recent Posts

AUDJPY Wave Analysis – 5 December 2025

AUDJPY: ⬆️ Buy - AUDJPY broke long-term resistance level 102.30 - Likely to rise to…

13 minutes ago

Aptos Wave Analysis – 5 December 2025

Aptos: ⬇️ Sell - Aptos testing major support at 1.688 - Likely to fall to…

14 minutes ago

Pro News Weekly: Market Shake-Up, Dollar Drops, Gold Surges, Bitcoin Wobbles!

Welcome to Pro News Flash! 💵 The U.S. dollar slips 🏆 Major stock indices struggle…

6 hours ago

Solana Wave Analysis – 5 December 2025

Solana: ⬇️ Sell - Solana reversed from resistance zone - Likely to fall to support…

7 hours ago

EURAUD Wave Analysis – 5 December 2025

EURAUD : ⬇️ Sell - EURAUD broke the support level 1.7600 - Likely to fall…

7 hours ago

Forex has set its priorities

In 2026, experts favour the yen, see modest euro growth, and expect pressure on the…

11 hours ago

This website uses cookies