Categories: Technical analysis

USDCAD Wave Analysis 19 June 2024

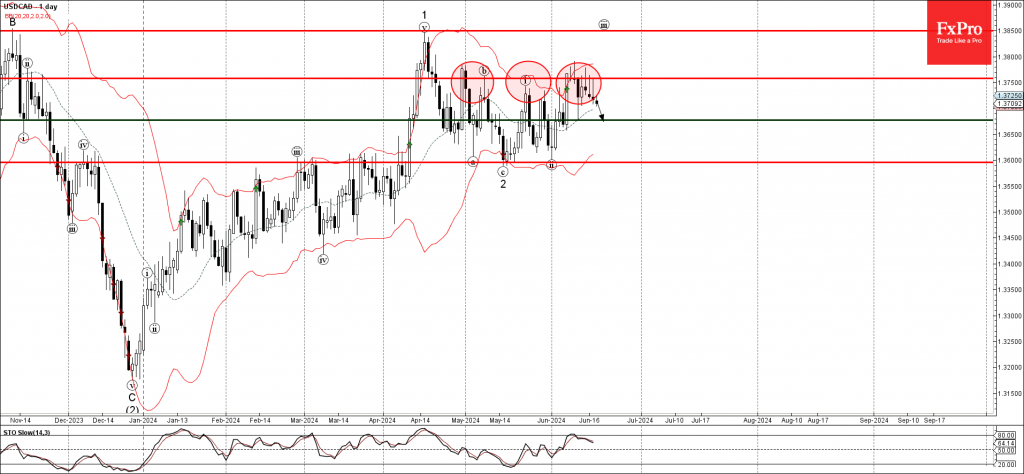
– USDCAD reversed from pivotal resistance level 1.3760

– Likely to fall to support level 1.3675

USDCAD currency pair under the bearish pressure after the price reversed down 3 times in a row from the pivotal resistance level 1.3760 (which has been reversing the price from the end of April).

Each of the last 3 downward reversals form the resistance level 1.3760 created the daily Japanese candlesticks reversal patterns Hammer.

Given the strength of the resistance level 1.3760, USDCAD currency pair can be expected to fall further to the next support level 1.3675.

The FxPro Tech Analysis Team

The FxPro technical experts prepare a daily analysis of the most active currency pairs (majors, crosses, exotics) and commodities. Selected instruments are reviewed on daily trends (D1, H4), using the active Elliott Wave setups, Japanese candlesticks, indicators, and support/resistance levels.

Share
Published by
The FxPro Tech Analysis Team
Tags: USDCAD

Recent Posts

EBAY Wave Analysis 2 July 2024

- EBAY reversed from support level 52.00 - Likely to rise to resistance level 54.60…

2 hours ago

CADJPY Wave Analysis 2 July 2024

- CADJPY broke key resistance level 117.00 - Likely to reach resistance level 119.00 CADJPY…

2 hours ago

Eurozone: Inflation Deceleration Stalled

According to the Eurostat Flash estimate, the euro area CPI stood at 2.5% y/y, hovering…

7 hours ago

Dollar Rises on Other Currencies’ Problems

The US dollar has been settling near two-month highs since late last week, but this…

10 hours ago

Stocks Held Back Crypto Gains

Market picture The crypto market retreated by 0.6% in 24 hours to a total cap…

13 hours ago

AUDUSD Wave Analysis 1 July 2024

- AUDUSD reversed from strong resistance zone - Likely to fall to support level 0.6620…

1 day ago

This website uses cookies