Categories: Technical analysis

USDCAD Wave Analysis – 19 April 2023

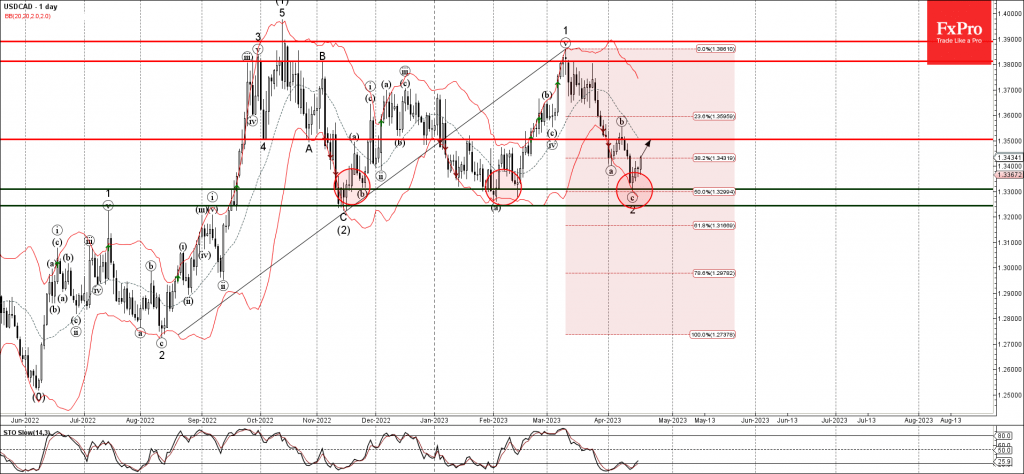
• USDCAD reversed from powerful support level 1.3300

• Likely to rise to resistance level 1.3500

USDCAD recently reversed up from the powerful support level 1.3300 (which has been reversing the price from the middle of November) coinciding with the lower daily Bollinger Band and the 50% Fibonacci retracement of the previous upward impulse from August.

The upward reversal from the support level 1.3300 stopped the previous minor correction ABC 2.

USDCAD can then be expected to rise further toward the next resistance level 1.3500 (top of the earlier correction (b) from the start of April).

The FxPro Tech Analysis Team

The FxPro technical experts prepare a daily analysis of the most active currency pairs (majors, crosses, exotics) and commodities. Selected instruments are reviewed on daily trends (D1, H4), using the active Elliott Wave setups, Japanese candlesticks, indicators, and support/resistance levels.

Share
Published by
The FxPro Tech Analysis Team
Tags: USDCAD

Recent Posts

EURCAD Wave Analysis 6 September 2024

- EURCAD reversed from pivotal support level 1.4900 - Likely to rise to resistance level…

1 day ago

EURUSD Wave Analysis 6 September 2024

- EURUSD reversed from support level 1.1030 - Likely to rise to resistance level 1.1200…

1 day ago

Further Unwinding of Carry Trade

The unwinding of the carry trade in the FX market continues, with the major safe…

1 day ago

Bitcoin pressured by risk-off mood

Market Picture The pressure on risk assets continues, pushing the crypto market capitalisation back below…

2 days ago

AUDUSD Wave Analysis 5 September 2024

- AUDUSD reversed from support level 0.6700 - Likely to rise to resistance level 0.6800…

2 days ago

Gold Wave Analysis 5 September 2024

- Gold reversed from support level 2475.00 - Likely to rise to resistance level 2535.00…

2 days ago

This website uses cookies