Categories: Technical analysis

USDCAD Wave Analysis 16 August 2023

– USDCAD broke resistance level 1.3470

– Likely to rise to resistance level 1.3635

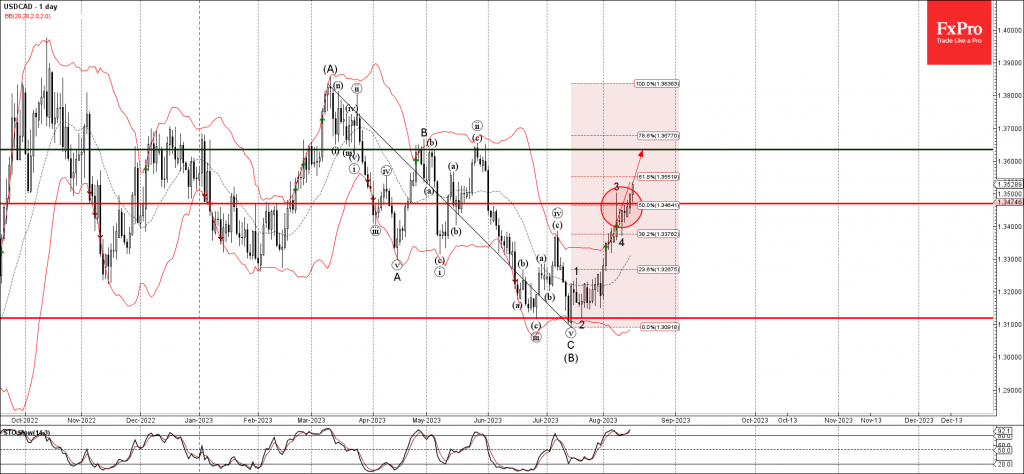
USDCAD currency pair recently broke the key resistance level 1.3470 (which stopped the previous impulse wave 3 at the start of August).

The breakout of the resistance level 1.3470 coincided with the breakout of the 50% Fibonacci correction of the previous ABC correction (B) from the start of March.

Given the strength of the active impulse wave 5, USDCAD can be expected to rise further toward the next resistance level 1.3635 (which stopped the previous waves B and ii).

The FxPro Tech Analysis Team

The FxPro technical experts prepare a daily analysis of the most active currency pairs (majors, crosses, exotics) and commodities. Selected instruments are reviewed on daily trends (D1, H4), using the active Elliott Wave setups, Japanese candlesticks, indicators, and support/resistance levels.

Share
Published by
The FxPro Tech Analysis Team
Tags: USDCAD

Recent Posts

EURCAD Wave Analysis 6 September 2024

- EURCAD reversed from pivotal support level 1.4900 - Likely to rise to resistance level…

1 day ago

EURUSD Wave Analysis 6 September 2024

- EURUSD reversed from support level 1.1030 - Likely to rise to resistance level 1.1200…

1 day ago

Further Unwinding of Carry Trade

The unwinding of the carry trade in the FX market continues, with the major safe…

1 day ago

Bitcoin pressured by risk-off mood

Market Picture The pressure on risk assets continues, pushing the crypto market capitalisation back below…

2 days ago

AUDUSD Wave Analysis 5 September 2024

- AUDUSD reversed from support level 0.6700 - Likely to rise to resistance level 0.6800…

2 days ago

Gold Wave Analysis 5 September 2024

- Gold reversed from support level 2475.00 - Likely to rise to resistance level 2535.00…

2 days ago

This website uses cookies