Categories: Technical analysis

USDCAD Wave Analysis 15 January, 2021

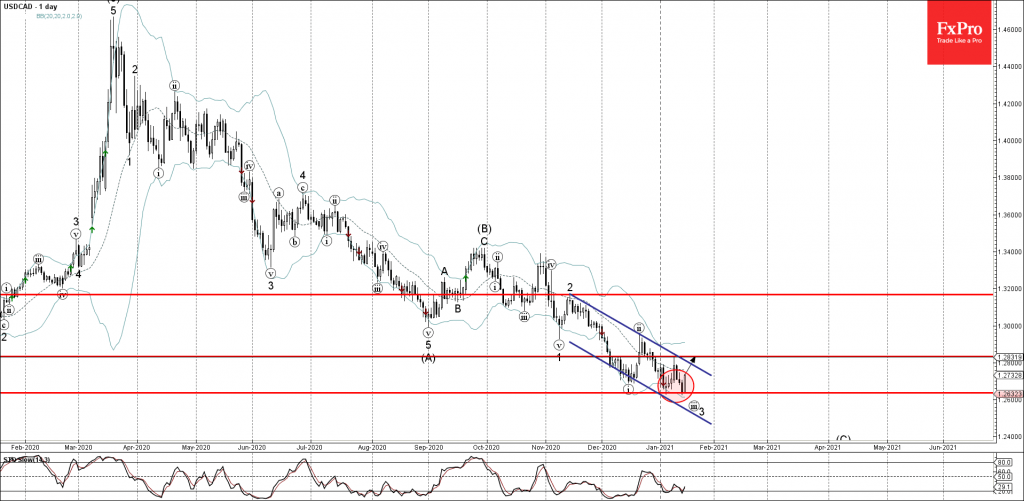
• USDCAD reversed from pivotal support 1.2635

• Likely to rise to 1.2830

USDCAD recently rose sharply from the pivotal support 1.2635 (which stopped the previous minor impulse wave (i) in the middle of December), intersecting with the lower daily Bollinger Band.

The upward reversal from the support 1.2635 will most likely create the daily Japanese candlesticks reversal pattern Bullish Engulfing.

USDCAD is expected to rise further toward the next resistance level 1.2830 (top of the candlesticks reversal pattern Dark Cloud Cover from the start of January).

The FxPro Tech Analysis Team

The FxPro technical experts prepare a daily analysis of the most active currency pairs (majors, crosses, exotics) and commodities. Selected instruments are reviewed on daily trends (D1, H4), using the active Elliott Wave setups, Japanese candlesticks, indicators, and support/resistance levels.

Share
Published by
The FxPro Tech Analysis Team
Tags: USDCAD

Recent Posts

The dollar does not tolerate dissent

US GDP growth is driven not by the White House, but by AI. The Bank…

5 hours ago

The crypto market has made a breakthrough

The crypto market surges, hitting new highs, with bullish sentiment for Bitcoin and Ethereum amid…

5 hours ago

Brent Crude oil Wave Analysis – 13 January 2026

Brent Crude oil ⬆️ Buy - Brent Crude oil rising inside impulse wave c -…

19 hours ago

USDJPY Wave Analysis – 13 January 2026

USDJPY ⬆️ Buy - USDJPY broke resistance area - Likely to rise to resistance level…

19 hours ago

Exxon Mobil Wave Analysis – 13 January 2026

Exxon Mobil ⬆️ Buy - Exxon Mobil broke resistance level 125.60 - Likely to rise…

19 hours ago

BNB Wave Analysis – 13 January 2026

Brent Crude oil ⬆️ Buy - BNB broke out of sideways price range - Likely…

19 hours ago

This website uses cookies