Categories: Technical analysis

USDCAD Wave Analysis 14 November 2024

– USDCAD broke resistance level 1.3950

– Likely to rise to resistance level 1.4050

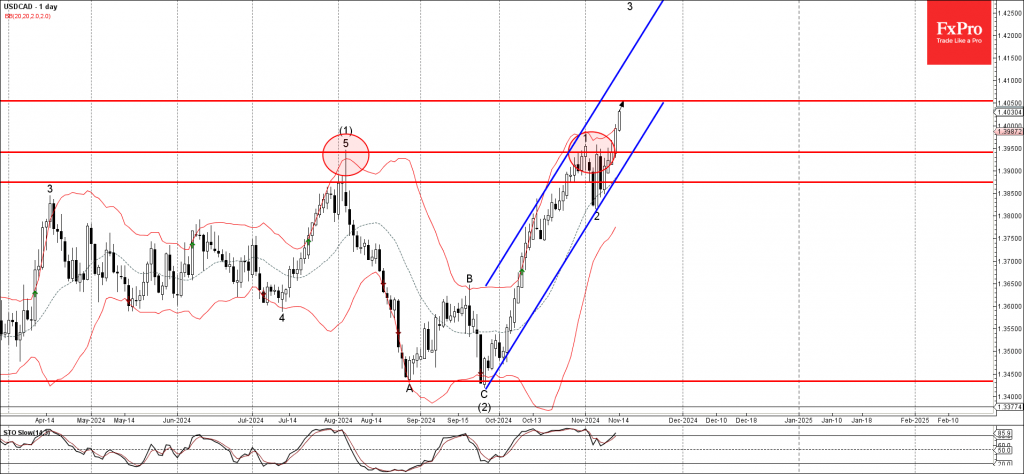
USDCAD currency pair rising strongly after the earlier breakout of the resistance level 1.3950 (former multi-month high from August).

The breakout of the resistance level 1.3950 accelerated the active short-term impulse wav 3 of the higher order impulse wave (3) from the end of September.

Given the continuation of the bullish US dollar sentiment seen across the FX markets today, USDCAD currency pair can be expected to rise to the next resistance level 1.4050.

The FxPro Tech Analysis Team

The FxPro technical experts prepare a daily analysis of the most active currency pairs (majors, crosses, exotics) and commodities. Selected instruments are reviewed on daily trends (D1, H4), using the active Elliott Wave setups, Japanese candlesticks, indicators, and support/resistance levels.

Share
Published by
The FxPro Tech Analysis Team
Tags: USDCAD

Recent Posts

NZDCAD Wave Analysis – 7 January 2026

NZDCAD: ⬆️ Buy - NZDCAD reversed from support zone - Likely to rise to resistance…

10 hours ago

Bitcoin Wave Analysis – 7 January 2026

Bitcoin: ⬇️ Sell - Bitcoin reversed from resistance zone - Likely to fall to support…

10 hours ago

EURGBP Wave Analysis – 7 January 2026

EURGBP: ⬆️ Buy - EURGBP reversed from support zone - Likely to rise to resistance…

10 hours ago

Brent Crude Oil Wave Analysis – 7 January 2026

Brent Crude Oil: ⬇️ Sell - Brent Crude Oil reversed from resistance zone - Likely…

10 hours ago

Old fears about the euro have returned

The resurgence of the political crisis in France is weighing on EURUSD The US dollar…

19 hours ago

The crypto market has hit the upper limit of its rebound

The crypto market faces resistance at $3.2T; sentiment rises, but selling pressure persists. Bitcoin and…

22 hours ago

This website uses cookies