Categories: Technical analysis

USDCAD Wave Analysis – 14 July 2023


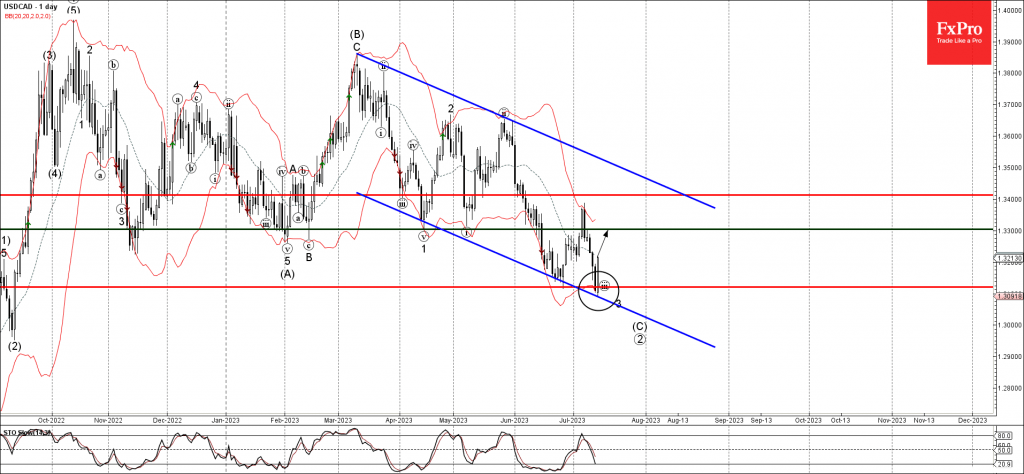
– USDCAD reversed from support level 1.3120

– Likely to rise to resistance level 1.3300

USDCAD currency pair recently reversed up strongly from the support level 1.3120 (previous monthly low from July), intersecting with the daily down channel from March and the lower daily Bollinger Band.

The upward reversal from the support level 1.3120 will most likely form the daily Bullish Engulfing – strong buy signal for this currency pair.

Given the bullish divergence on the daily Stochastic indicator, USDCAD currency pair can be expected to rise further toward the next resistance level 1.3300.

The FxPro Tech Analysis Team

The FxPro technical experts prepare a daily analysis of the most active currency pairs (majors, crosses, exotics) and commodities. Selected instruments are reviewed on daily trends (D1, H4), using the active Elliott Wave setups, Japanese candlesticks, indicators, and support/resistance levels.

Share
Published by
The FxPro Tech Analysis Team
Tags: USDCAD

Recent Posts

Pro News Weekly: Market Shake-Up, Dollar Drops, Gold Surges, Bitcoin Wobbles!

Welcome to Pro News Flash! 💵 The U.S. dollar slips 🏆 Major stock indices struggle…

6 hours ago

Solana Wave Analysis – 5 December 2025

Solana: ⬇️ Sell - Solana reversed from resistance zone - Likely to fall to support…

6 hours ago

EURAUD Wave Analysis – 5 December 2025

EURAUD : ⬇️ Sell - EURAUD broke the support level 1.7600 - Likely to fall…

6 hours ago

Forex has set its priorities

In 2026, experts favour the yen, see modest euro growth, and expect pressure on the…

11 hours ago

Bear market rebound in crypto is likely to continue

Crypto rebounds continue; Bitcoin faces resistance, with a mixed market outlook ahead, as regulatory changes…

12 hours ago

Coca-Cola Wave Analysis – 4 December 2025

Coca-Cola: ⬇️ Sell - Coca-Cola reversed from long-term resistance level 73.25 - Likely to fall to…

1 day ago

This website uses cookies