Categories: Technical analysis

USDCAD Wave Analysis 12 April 2024

– USDCAD broke key resistance level 1.3625

– Likely to rise to resistance level 1.3860

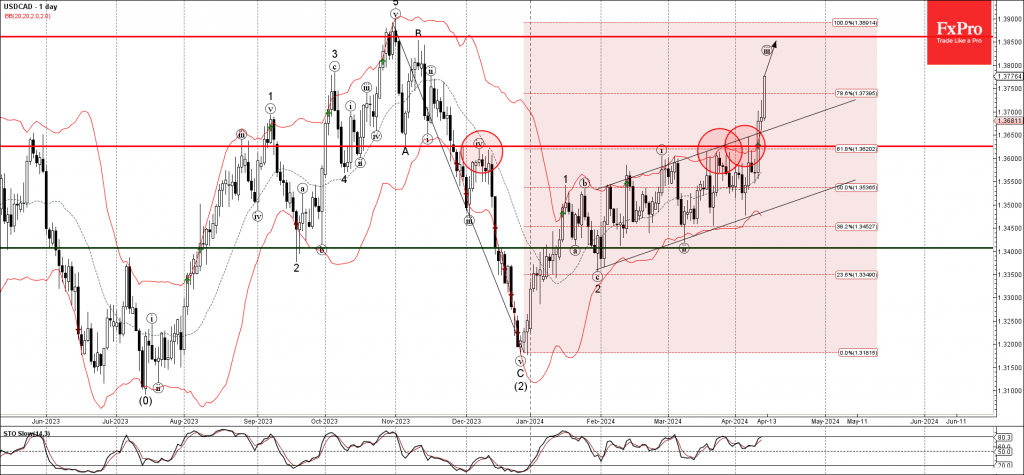
USDCAD rising strongly after the earlier breakout of the key resistance level 1.3625 (which has been reversing the price from December) intersecting with the 61.8% Fibonacci correction of the downward ABC correction (2) from November.

The breakout of the resistance level 1.3625 coincided with the breakout of the daily up channel from January.

USDCAD can be expected to rise further to the next resistance level 1.3860 (former multi-month high from October, and the target for the completion of the active impulse iii).

The FxPro Tech Analysis Team

The FxPro technical experts prepare a daily analysis of the most active currency pairs (majors, crosses, exotics) and commodities. Selected instruments are reviewed on daily trends (D1, H4), using the active Elliott Wave setups, Japanese candlesticks, indicators, and support/resistance levels.

Share
Published by
The FxPro Tech Analysis Team
Tags: USDCAD

Recent Posts

CHFJPY Wave Analysis – 9 January 2026

CHFJPY: ⬆️ Buy - CHFJPY reversed from support area - Likely to rise to resistance…

15 hours ago

Exxon Mobil Wave Analysis – 9 January 2026

Exxon Mobil: ⬆️ Buy - Exxon Mobil reversed from support area - Likely to rise…

15 hours ago

Pro News Weekly: Dollar Rebounds as Markets Test New Limits

Welcome to Pro News Weekly! Here’s what is shaping the markets: 💵 The U.S. dollar…

19 hours ago

Geopolitics will destroy the euro

•    EURUSD falls due to geopolitics and expectations of tariff removal •    Gold returns to…

1 day ago

Platinum Wave Analysis – 8 January 2026

Platinum: ⬇️ Sell - Platinum reversed from pivotal resistance level 150.00 - Likely to fall to…

2 days ago

Baidu Wave Analysis – 8 January 2026

Baidu: ⬇️ Sell - Baidu reversed from resistance zone - Likely to fall to support level…

2 days ago

This website uses cookies