Categories: Technical analysis

USDCAD Wave Analysis 11 July 2024

– USDCAD reversed from key support level 1.3600

– Likely to rise to resistance level 1.3700

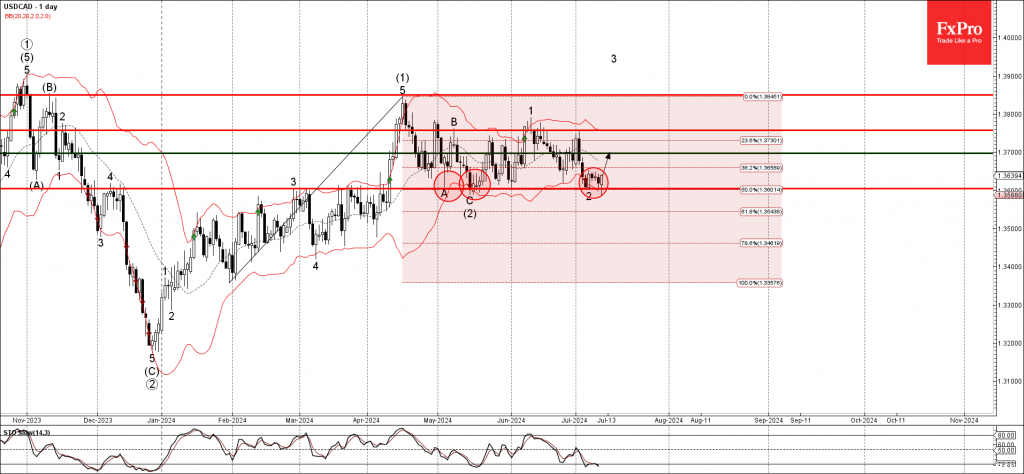
USDCAD currency pair recently reversed up from the key support level 1.3600, which has been steadily reversing the price from the start of May.

The support level 1.3600 was strengthened by the lower daily Bollinger Band and by the 50% Fibonacci correction level of the previous upward impulse from January.

Given the predominant daily uptrend, oversold daily Stochastic and the rising bullish USD sentiment, USDCAD currency pair can be expected to rise further to the next resistance level 1.3700.

The FxPro Tech Analysis Team

The FxPro technical experts prepare a daily analysis of the most active currency pairs (majors, crosses, exotics) and commodities. Selected instruments are reviewed on daily trends (D1, H4), using the active Elliott Wave setups, Japanese candlesticks, indicators, and support/resistance levels.

Share
Published by
The FxPro Tech Analysis Team
Tags: USDCAD

Recent Posts

Weak Chinese data paves the way for lower yuan

Saturday's statistics from China added to fears of a slowdown in the world's second-largest economy,…

5 hours ago

A new local peak in crypto?

Market Picture The crypto market started the weekend on a positive note but has been…

11 hours ago

Fed rate decision: intrigue returns

Influential financial media are promoting the need for a 50-basis point rate cut. The Fed's…

2 days ago

GBPCAD Wave Analysis 13 September 2024

GBPCAD reversed from strong resistance level 1.7850 Likely to fall to support level 1.7700 GBPCAD…

3 days ago

Ebay Wave Analysis 13 September 2024

- Ebay broke resistance level 62.00   - Likely to rise to the resistance level…

3 days ago

Gold broke through the ceiling

After three weeks of consolidation, gold moved decisively upwards, hitting a record above $2572 per…

3 days ago

This website uses cookies