Categories: Technical analysis

USDCAD Wave Analysis 11 February, 2021

• USDCAD under bearish pressure

• Likely to test support level 1.2600

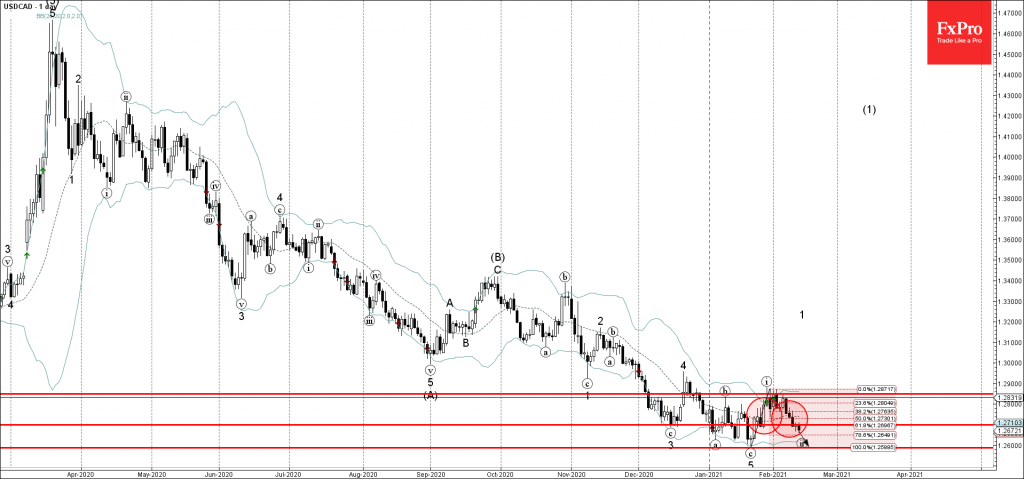
USDCAD currency pair under bearish pressure after the price broke the support level 1.2710 (low of the daily Bullish Engulfing from the end of January) standing close to the 61.8% Fibonacci correction of the upward impulse (i).

The breakout of the support level 1.2710 accelerated the active short-term ABC correction (ii) from the start of February.

Given the predominant downtrend – USDCAD can be expected to fall further toward the next support level 1.2600 (monthly low from January and the target for the completion of the active correction (ii)).

The FxPro Tech Analysis Team

The FxPro technical experts prepare a daily analysis of the most active currency pairs (majors, crosses, exotics) and commodities. Selected instruments are reviewed on daily trends (D1, H4), using the active Elliott Wave setups, Japanese candlesticks, indicators, and support/resistance levels.

Share
Published by
The FxPro Tech Analysis Team
Tags: USDCAD

Recent Posts

Gold Wave Analysis – 12 December 2025

Gold: ⬇️ Sell - Gold reversed from strong resistance level 4350.00 - Likely to fall to…

2 days ago

EURGBP Wave Analysis – 12 December 2025

EURGBP: ⬆️ Buy - EURGBP reversed from support zone - Likely to rise to resistance level…

2 days ago

Filecoin Wave Analysis – 12 December 2025

Filecoin: ⬇️ Sell - Filecoin broke key support level 1.435 - Likely to fall to support…

2 days ago

Ethereum Wave Analysis – 12 December 2025

Ethereum: ⬇️ Sell - Ethereum reversed from resistance level 3400.00 - Likely to fall to support…

2 days ago

Pro News Weekly: Global Markets at a Turning Point

Welcome to Pro News Weekly! Here’s what is moving the markets: 💵 The Fed fails…

3 days ago

Crypto: slight rebound within a bear market

Crypto rebounds slightly in a bear market; resistance holds, optimism rises, but the outlook remains…

3 days ago

This website uses cookies