Categories: Technical analysis

USDCAD Wave Analysis – 02 May, 2019

  • USDCAD reversed from key support level 1.3400
  • Further gains are likely

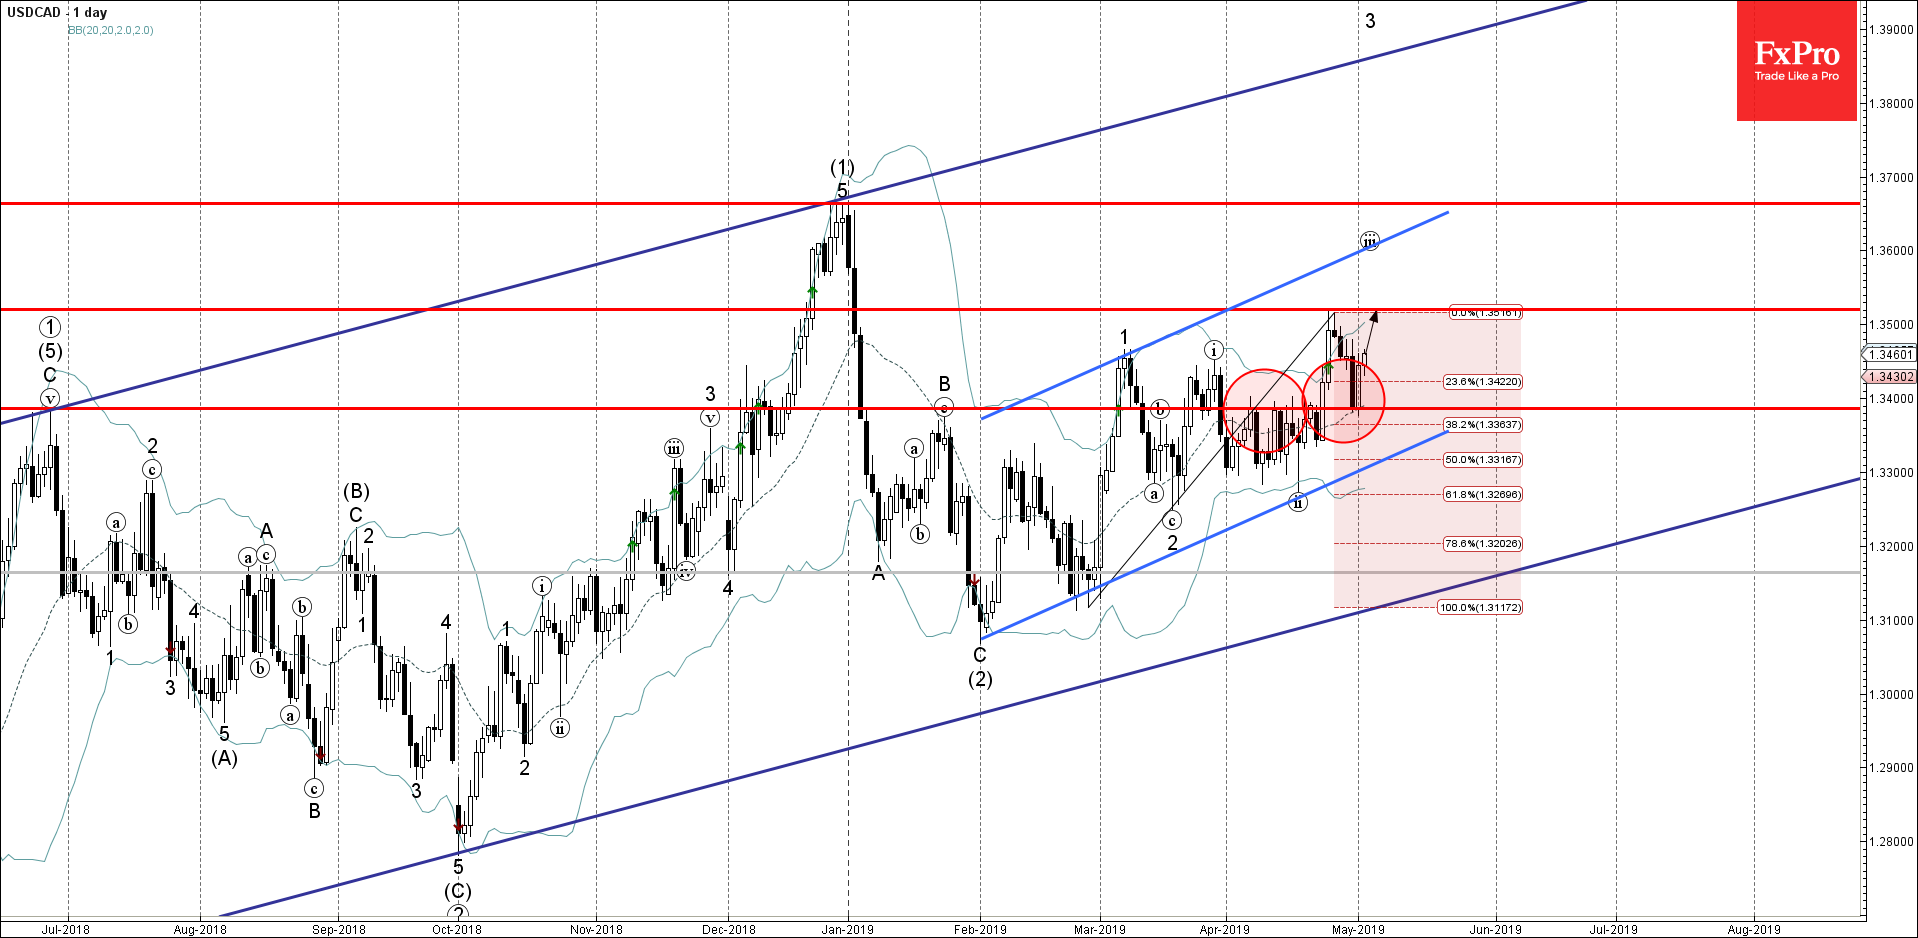
USDCAD continues to rise after the recent upward reversal from the key support level 1.3400 (former resistance level from the start of April) – strengthened by the 38.2% Fibonacci correction of the previous upward impulse from February.

The upward reversal from the support level 1.3400 created the daily Japanese candlesticks reversal pattern Piercing Line.

USDCAD is expected to rise further and re-test the next resistance level 1.3520 (monthly high from last month).

The FxPro Tech Analysis Team

The FxPro technical experts prepare a daily analysis of the most active currency pairs (majors, crosses, exotics) and commodities. Selected instruments are reviewed on daily trends (D1, H4), using the active Elliott Wave setups, Japanese candlesticks, indicators, and support/resistance levels.

Share
Published by
The FxPro Tech Analysis Team
Tags: USDCAD

Recent Posts

Nikkei 225 index Wave Analysis 20 September 2024

- Nikkei 225 index rising inside minor impulse waves 3 - Likely to reach resistance…

1 day ago

NZDJPY Wave Analysis 20 September 2024

- NZDJPY rising inside corrective wave ii - Likely to rise to resistance level 91.65…

1 day ago

Gold terminates the last sceptics

Gold started the week with new highs and ended the week up 1.3%, despite a…

2 days ago

The Crypto Market’s Steady Ascent

Crypto market cap rose by 3.2% to $2.21 trillion overnight. This made the struggle to…

2 days ago

Gold Wave Analysis 19 September 2024

- Gold reversed from support level 2550.00 - Likely to rise to resistance level 2600.00…

2 days ago

S&P 500 Wave Analysis 19 September 2024

- S&P 500 broke key resistance level 5670.00 - Likely to rise to resistance level…

2 days ago

This website uses cookies