The USDCAD rallied strongly earlier in the week on a decline towards the cross of the 50- and 200-day moving averages. The sharp jump of 1.2% to 1.2700 should be taken as a signal that investors in North America remain bullish on the USD despite short-term risks from the Bank of Canada rate meeting.

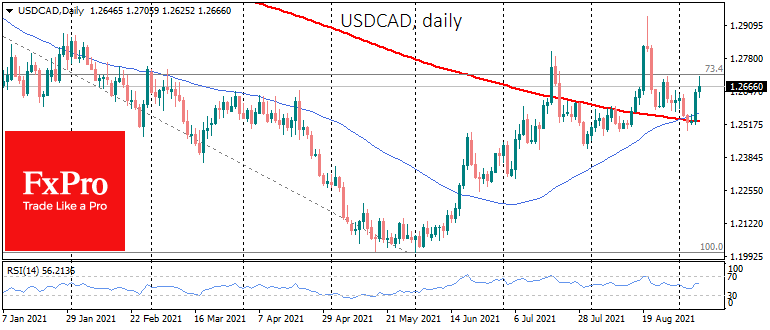
There is a “golden cross” in the USDCAD when the 50 SMA crosses the 200 SMA from the bottom to the top. In June, the pair sharply broke the resistance of the 50-day moving average and turned into support, which was confirmed in the previous week.
The 200 SMA is a bigger calibre weapon, and it acts as a long-term trend indicator. This month we are seeing more signs that this line is moving into support from resistance as well.
A bullish picture for the USDCAD opens the pair to the 1.3000 area, an important round level, plus the 2019 support and the 61.8% pullback of the pair’s March 2020 to June 2021 peaks are concentrated here.
The FxPro Analyst Team