Categories: Technical analysis

USDCAD broke key resistance level 1.3390

  • USDCAD broke key resistance level 1.3390
  • Further gains are likely

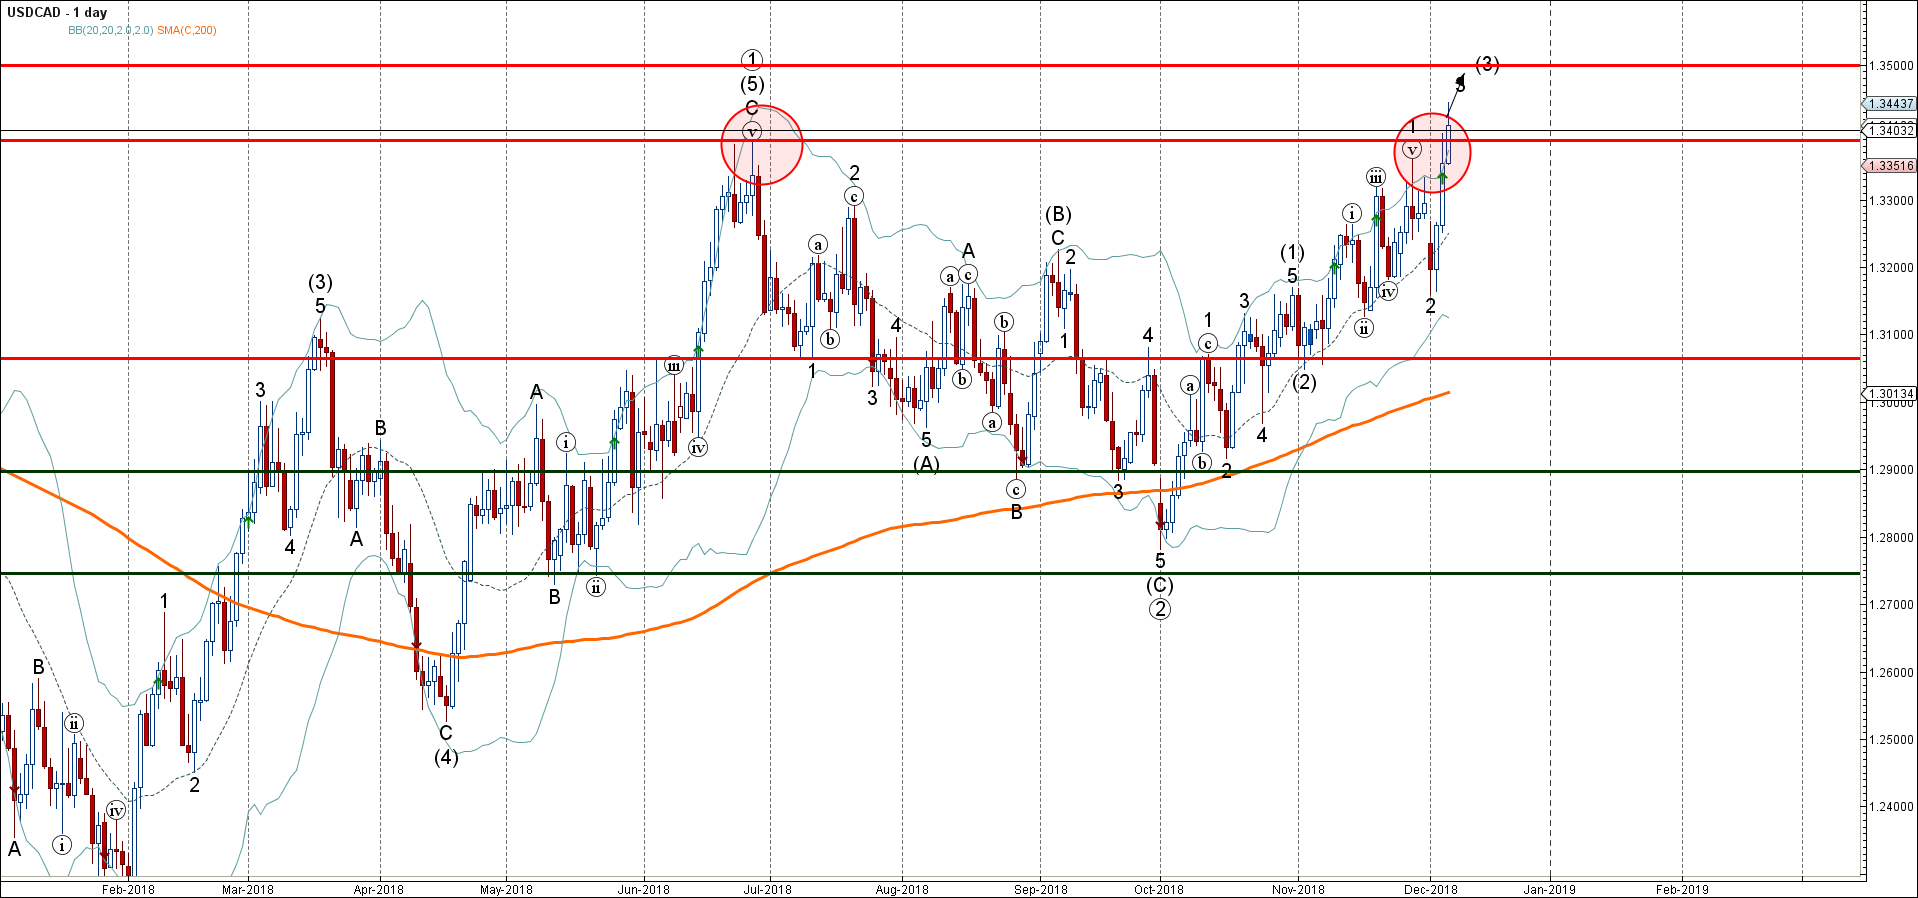
USDCAD today broke through the strong resistance level 1.3390 (which stopped the previous medium-term impulse wave (5) and the sharp daily uptrend in June – as can be seen from the daily chart below).

The breakout of the resistance level 1.3390 should accelerate the active medium–term impulse wave (3) – which belongs to the longer-term upward impulse sequence from the end of September.

USDCAD is expected to rise further and re-test the next resistance level 1.3500 (target price for the completion of the active impulse wave (3)).

The FxPro Tech Analysis Team

The FxPro technical experts prepare a daily analysis of the most active currency pairs (majors, crosses, exotics) and commodities. Selected instruments are reviewed on daily trends (D1, H4), using the active Elliott Wave setups, Japanese candlesticks, indicators, and support/resistance levels.

Share
Published by
The FxPro Tech Analysis Team
Tags: USDCAD

Recent Posts

Oil Bounces Locally, Global Support 5% below Spot Price 

The number of operating oil rigs in the US fell by 7 to 499. This…

3 hours ago

Crypto Market Tries to Break Local Downtrend

Market picture  Crypto market capitalisation has been up 2% over the past seven days and…

10 hours ago

Adobe Wave Analysis 3 May 2024

- Adobe reversed from support zone - Likely to rise to resistance level 500.00 Adobe…

3 days ago

EURGBP Wave Analysis 3 May 2024

- EURGBP reversed from support zone - Likely to rise to resistance level 0.8625 EURGBP…

3 days ago

How Low Can the USDJPY Go?

USDJPY was slipping below 153 on Friday morning, a three-week low and having lost over…

3 days ago

Bitcoin’s Downtrend, Solana and Ethereum Form Double Bottom

Market picture  Crypto market capitalisation rose 3.3% in 24 hours to $2.22 trillion. Local capitalisation…

3 days ago

This website uses cookies