Categories: Technical analysis

USDCAD Analysis – 28 October 2025

USDCAD: ⬇️ Sell

– USDCAD falling inside wave C

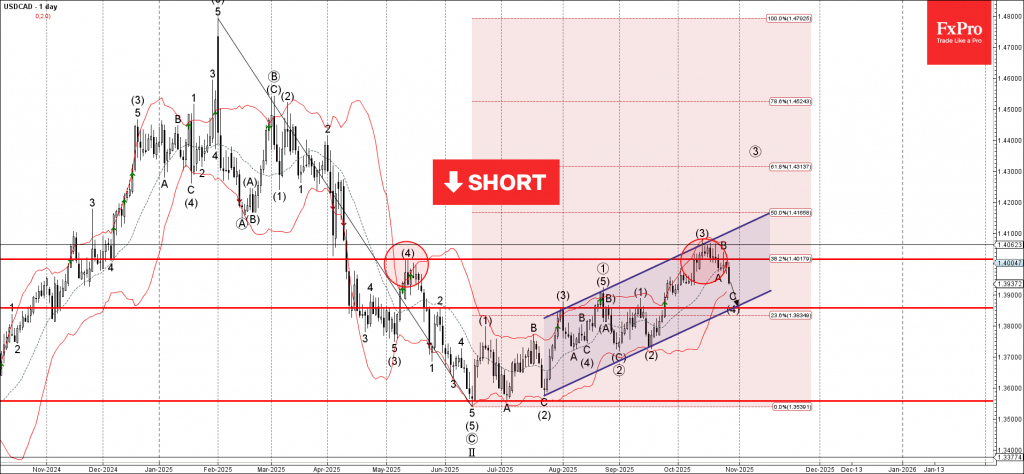
– Likely to test support level 1.3860

USDCAD currency pair recently reversed down from the resistance zone between the key resistance level 1.4015 (former monthly high from May), upper daily Bollinger Band and the 38.2% Fibonacci correction of the downward impulse from January.

This resistance zone was further strengthened by the resistance trendline of the daily up channel from July.

Given the strongly bearish US dollar sentiment seen today, USDCAD currency pair can be expected to fall to the next support level 1.3860 (target for the completion of the active wave C).

The FxPro Tech Analysis Team

The FxPro technical experts prepare a daily analysis of the most active currency pairs (majors, crosses, exotics) and commodities. Selected instruments are reviewed on daily trends (D1, H4), using the active Elliott Wave setups, Japanese candlesticks, indicators, and support/resistance levels.

Share
Published by
The FxPro Tech Analysis Team
Tags: USDCAD

Recent Posts

EURJPY Wave Analysis – 31 December 2025

EURJPY: ⬆️ Buy - EURJPY reversed from support area - Likely to rise to resistance…

2 days ago

Binance Coin Wave Analysis – 31 December 2025

Binance Coin: ⬆️ Buy - Binance Coin broke Descending Triangle - Likely to rise to…

2 days ago

Uniswap Wave Analysis – 31 December 2025

Uniswap: ⬇️ Sell - Uniswap reversed from resistance area - Likely to fall to support…

2 days ago

S&P 500 Wave Analysis – 31 December 2025

S&P 500: ⬇️ Sell - S&P 500 reversed from strong resistance level 6935.00 - Likely…

2 days ago

The dollar may defy expectations

•  The return of American exceptionalism will help the greenback. •  The yen will start…

2 days ago

Stellar Wave Analysis – 30 December 2025

Stellar: ⬇️ Sell - Stellar reversed from resistance area - Likely to fall to support…

2 days ago

This website uses cookies