Crude oil is set to enter a volatile period with the start of the OPEC meeting in Vienna on Friday. Traders should also remain alert to market moving headlines ahead of the meeting as ministers from OPEC members are attending the OPEC international seminar and may give interviews to the media. Oil prices have been falling in recent weeks due to the possibility of OPEC agreeing to higher production. Additionally, President Trump has been applying pressure on OPEC to increase production to reduce oil prices but it is questionable that this a genuine request as the high prices support US shale oil production.
The API data on Wednesday reported a draw of 3.02 million barrels in US crude inventory for the week. Focus will now turn to inventory data reported by the Energy Information Administration (EIA) later today which is expected to show a draw of 2.43 million barrels.
On the weekly chart, WTI found resistance at the 73.00 level and has retraced back to horizontal support at 63.20. A weekly close above 66.70 is needed to open the way for WTI to continue to trend towards the inverted head and shoulders target at 82.50 with resistance at 73.00 and then the 61.8% Fibonacci at 77.00. However, a break of 63.20 would result in more downside with support at 58.50.
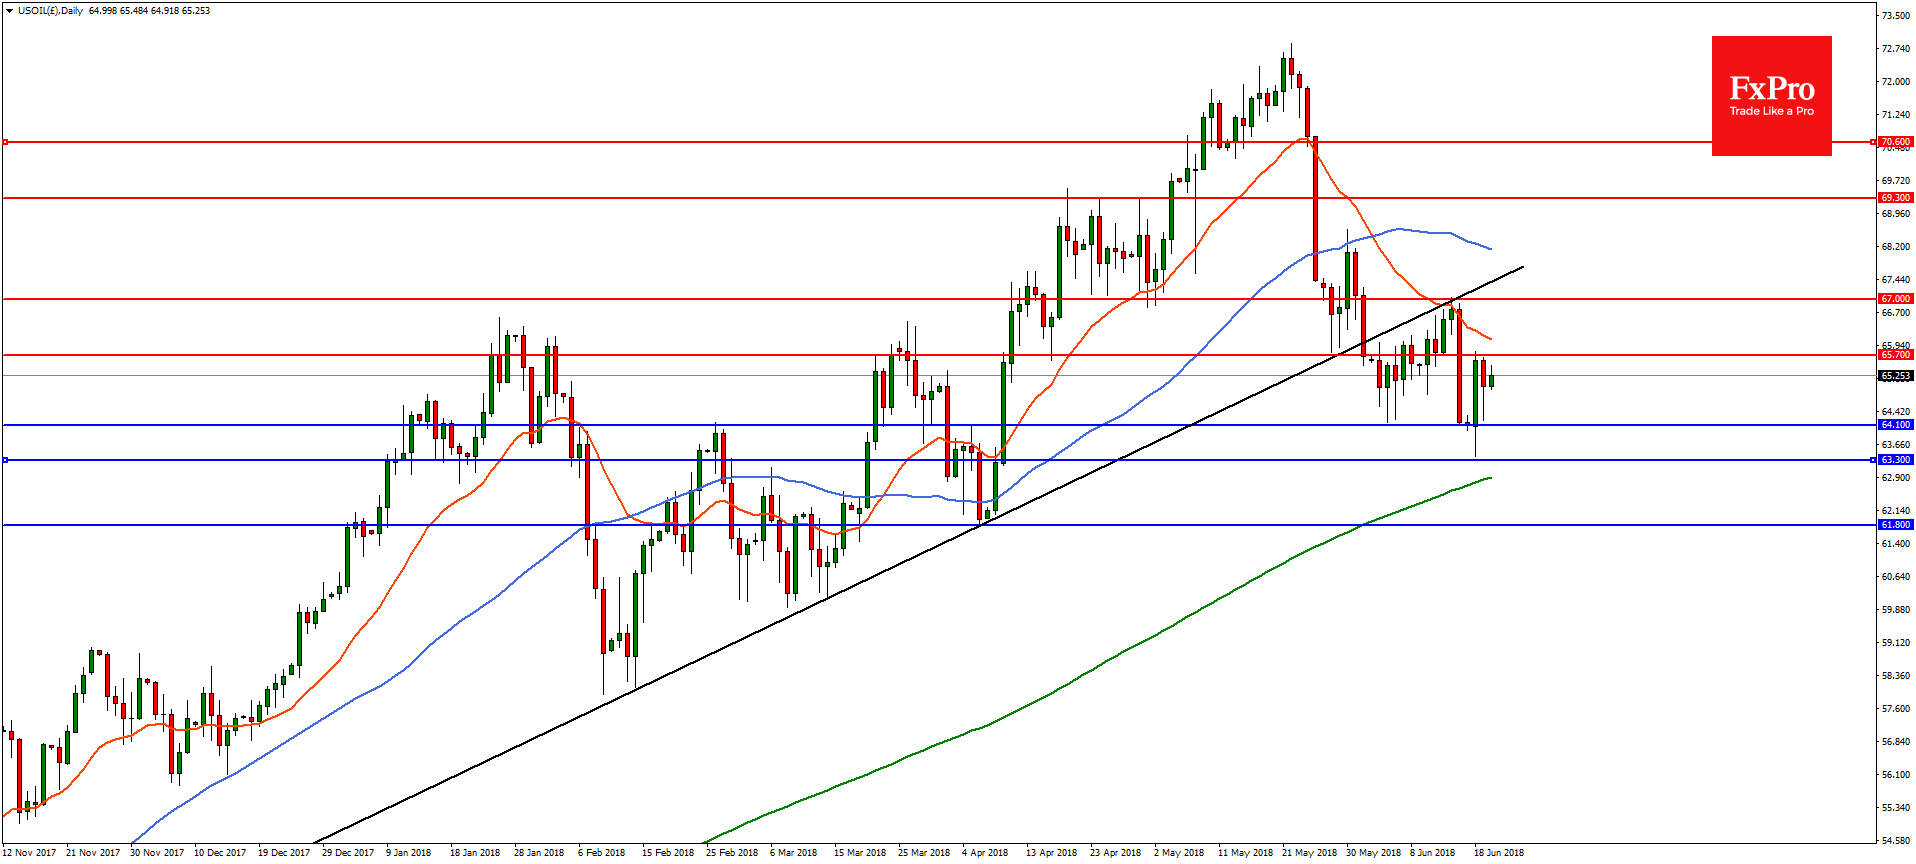
On the daily chart, the pullback in WTI found support at 64.10 ahead of OPEC. A break of the 23.6% retracement at 65.70 is needed for the upside to resume with resistance near the trend line at 67.00 and then at the 61.8% retracement level of 69.30. On the flip-side, a break of 64.10 could result is a downside move to support at 63.30 and then 61.80.