September confirmed its title as the worst month of the year for US equities. Seasonal patterns suggest a much more optimistic view of the market outlook for the rest of the year. However, investors should not rush to stock purchases right from the first minutes of the new month and quarter.

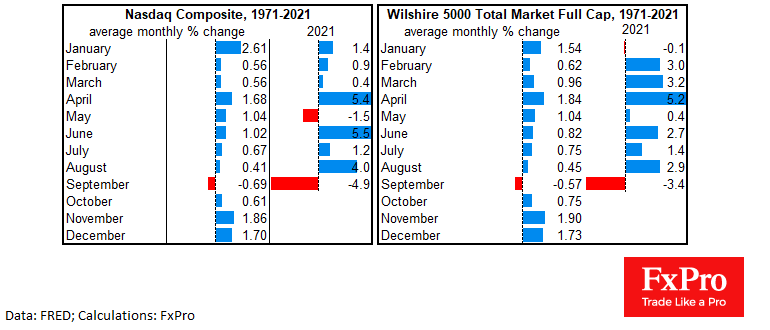
The calculation on the history of the last 50 years available for the Nasdaq Composite (dominated by high-tech companies now) and for the Wilshire5000 Total Market Full Cap (the broadest US market index) makes for an optimistic view of the last quarter.
In October, the markets have on average managed to overcome the previous month’s downturn, with the greatest growth momentum in equities occurring between November and January, when the average monthly gain exceeds 1.5%.
But October had the most devastating episodes of market declines, with the Nasdaq lost 27% and Wilshire sank 23% in 1987, and both indices decreased 17.5% in October 2008. The best October performance was in 1974, with the Nasdaq up 17.2% and Wilshire up 17.6%.
A closer look at the latest development points to a correction in the stock markets on tightening the monetary policy tone. The relative strength index on the daily Nasdaq charts is approaching 30, an oversold area where it has not been since March 2020, and this could be a harbinger of increased volatility in the coming days. A buy signal in such cases is a return of the RSI to neutral territory above 30 rather than a mechanical exit to oversold territory.
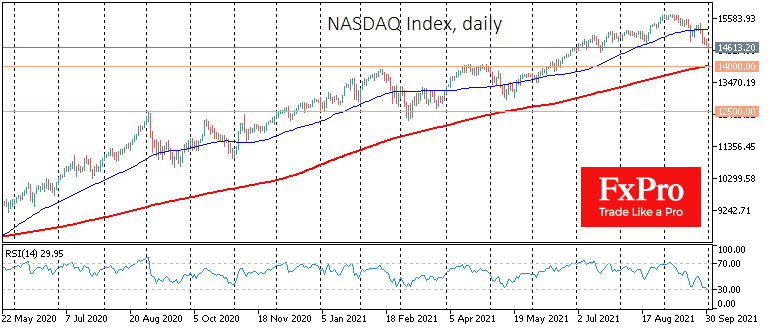
The bears had the upper hand recently. The Nasdaq is losing for the fifth consecutive trading session, dipped below the previous lows. From the current levels near 14650, the index may not encounter any significant obstacles until the area of 14000 (-4.5% from the current levels), where the February and April peaks and the 200-day moving average are situated.
A more profound decline of the index would reflect a much more negative process than the regular correction and could indicate an economic recession. Potentially, this cannot be ruled out in case of an energy crisis and the Fed’s intention to suppress inflation. However, such a development looks like a highly pessimistic scenario, with a low chance of materialising.
In our view, the markets are in the process of reassessing the overly optimistic expectations and valuations that have dragged equities up in recent months, but with monetary policy maintaining a broadly stimulative bias and the economy maintaining an impressive growth rate, which has caused logistical problems. But this situation promises to rectify itself in the coming weeks.
The FxPro Analyst Team