Categories: Technical analysis

Unilever Wave Analysis – 25 November, 2021

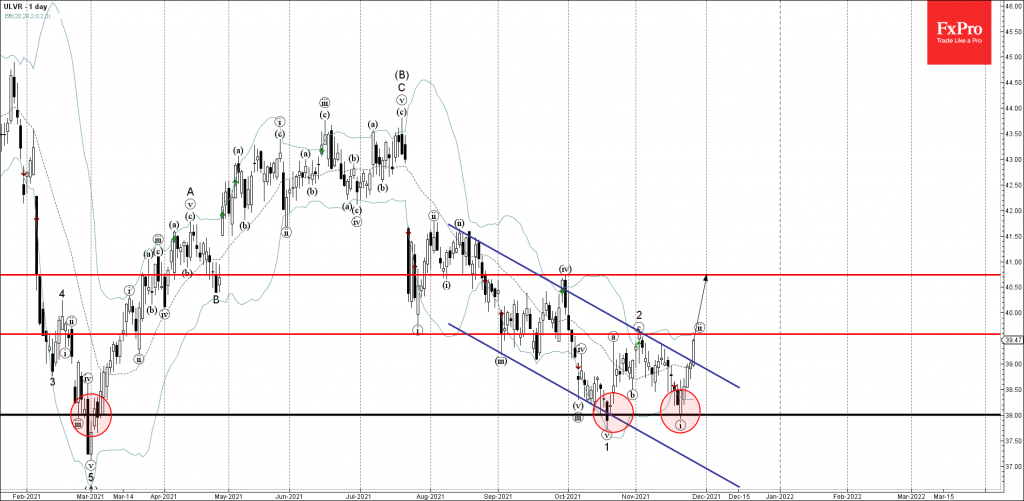
• Unilever broke daily down channel

• Likely to rise to resistance levels 39.60 and 40.75


Unilever continues to rise after the earlier breakout of the resistance trendline of the daily down channel from August – inside which the price has been moving from August.

The breakout of this down channel continues the active impulse wave (iii) of the longer-term upward impulse 3 from the middle of October.

Unilever can be expected to rise further toward the next resistance levels 39.60 (top of the earlier minor correction 2) and 40.75 (monthly high from September).

The FxPro Tech Analysis Team

The FxPro technical experts prepare a daily analysis of the most active currency pairs (majors, crosses, exotics) and commodities. Selected instruments are reviewed on daily trends (D1, H4), using the active Elliott Wave setups, Japanese candlesticks, indicators, and support/resistance levels.

Share
Published by
The FxPro Tech Analysis Team
Tags: Unilever

Recent Posts

Pro News Weekly: Market Shake-Up, Dollar Drops, Gold Surges, Bitcoin Wobbles!

Welcome to Pro News Flash! 💵 The U.S. dollar slips 🏆 Major stock indices struggle…

3 hours ago

Solana Wave Analysis – 5 December 2025

Solana: ⬇️ Sell - Solana reversed from resistance zone - Likely to fall to support…

3 hours ago

EURAUD Wave Analysis – 5 December 2025

EURAUD : ⬇️ Sell - EURAUD broke the support level 1.7600 - Likely to fall…

3 hours ago

Forex has set its priorities

In 2026, experts favour the yen, see modest euro growth, and expect pressure on the…

8 hours ago

Bear market rebound in crypto is likely to continue

Crypto rebounds continue; Bitcoin faces resistance, with a mixed market outlook ahead, as regulatory changes…

9 hours ago

Coca-Cola Wave Analysis – 4 December 2025

Coca-Cola: ⬇️ Sell - Coca-Cola reversed from long-term resistance level 73.25 - Likely to fall to…

22 hours ago

This website uses cookies