Categories: Technical analysis

Trump Coin Wave Analysis – 8 October 2025

Trump Coin: ⬇️ Sell

  • Trump Coin reversed from resistance zone
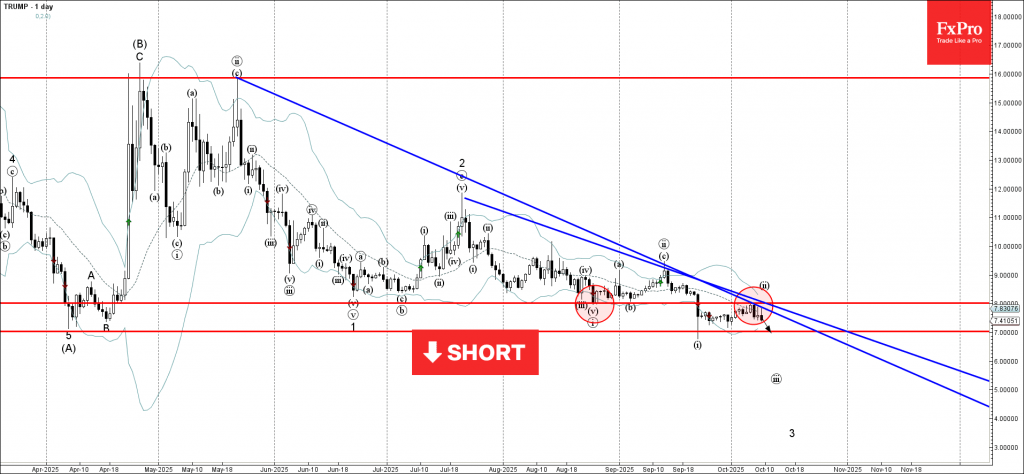
  • Likely to fall to support level 4000.00

Trump Coin recently reversed down from the resistance zone located between the round resistance level 8.00 (former strong support from August) and the two multi-month resistance trendlines from July and May.

The downward reversal from this resistance zone created the daily Japanese candlesticks reversal pattern Bearish Engulfing.

Given the clear daily downtrend, Trump Coin can be expected to fall to the next round support level 7.00 (which stopped earlier impulse wave i in September).

The FxPro Tech Analysis Team

The FxPro technical experts prepare a daily analysis of the most active currency pairs (majors, crosses, exotics) and commodities. Selected instruments are reviewed on daily trends (D1, H4), using the active Elliott Wave setups, Japanese candlesticks, indicators, and support/resistance levels.

Share
Published by
The FxPro Tech Analysis Team
Tags: trump

Recent Posts

Geopolitics will destroy the euro

•    EURUSD falls due to geopolitics and expectations of tariff removal •    Gold returns to…

19 minutes ago

Platinum Wave Analysis – 8 January 2026

Platinum: ⬇️ Sell - Platinum reversed from pivotal resistance level 150.00 - Likely to fall to…

13 hours ago

Baidu Wave Analysis – 8 January 2026

Baidu: ⬇️ Sell - Baidu reversed from resistance zone - Likely to fall to support level…

13 hours ago

EURUSD Wave Analysis – 8 January 2026

EURUSD: ⬇️ Sell - EURUSD broke daily up channel - Likely to fall to support…

15 hours ago

WTI crude oil Wave Analysis – 8 January 2026

WTI crude oil: ⬆️ Buy - WTI crude oil reversed from support zone - Likely…

15 hours ago

Do not underestimate dollar

Positive macro statistics for the US are helping the greenback. Gold could rise to $4,610…

22 hours ago

This website uses cookies